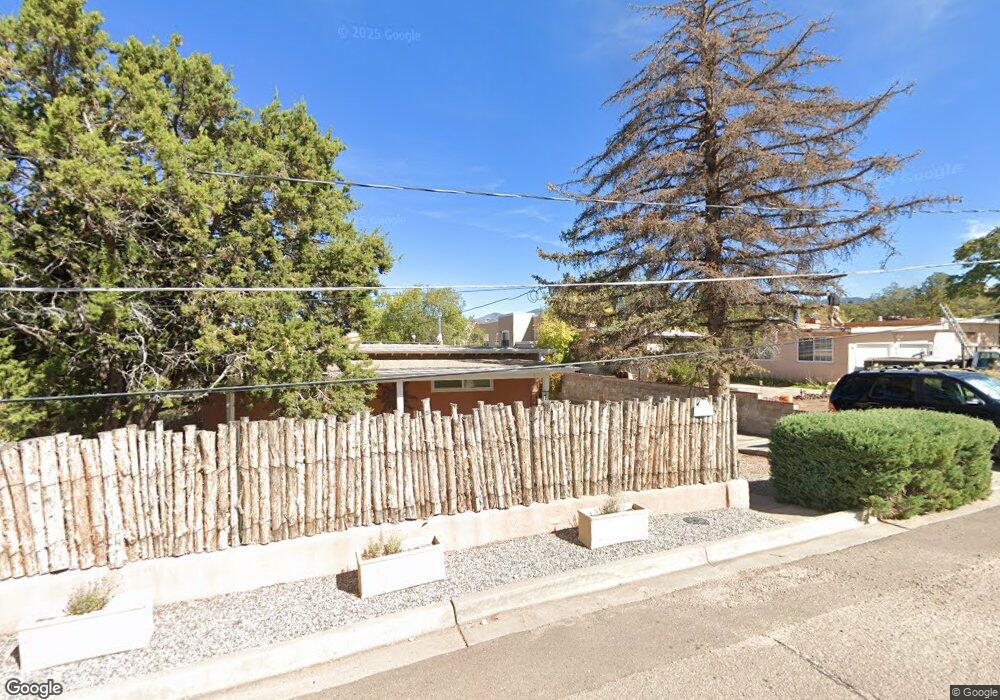
663 Bishops Lodge Rd Santa Fe, NM 87501
North Hills NeighborhoodEstimated Value: $515,793 - $550,000
3
Beds
--
Bath
1,285
Sq Ft
$412/Sq Ft
Est. Value
About This Home
This home is located at 663 Bishops Lodge Rd, Santa Fe, NM 87501 and is currently estimated at $529,198, approximately $411 per square foot. 663 Bishops Lodge Rd is a home located in Santa Fe County with nearby schools including Carlos Gilbert Elementary School, Santa Fe High School, and New Mexico School for the Arts.
Ownership History
Date
Name
Owned For
Owner Type
Purchase Details
Closed on
Jan 9, 2020
Sold by
Hamilton Heather M
Bought by
Khan Mir Faheem and Khan Andrea Campbell
Current Estimated Value
Home Financials for this Owner
Home Financials are based on the most recent Mortgage that was taken out on this home.
Original Mortgage
$255,000
Outstanding Balance
$225,736
Interest Rate
3.7%
Mortgage Type
New Conventional
Estimated Equity
$303,462
Purchase Details
Closed on
Jun 5, 2013
Sold by
Beal Kelly S
Bought by
Hamilton Heather M
Home Financials for this Owner
Home Financials are based on the most recent Mortgage that was taken out on this home.
Original Mortgage
$185,250
Interest Rate
3.43%
Mortgage Type
New Conventional
Purchase Details
Closed on
Dec 30, 2005
Sold by
Detmering Timothy J and Detmering Mary Ann
Bought by
Beal Kelly S
Create a Home Valuation Report for This Property
The Home Valuation Report is an in-depth analysis detailing your home's value as well as a comparison with similar homes in the area
Home Values in the Area
Average Home Value in this Area
Purchase History
| Date | Buyer | Sale Price | Title Company |
|---|---|---|---|
| Khan Mir Faheem | -- | Prime Title Llc | |
| Hamilton Heather M | -- | None Available | |
| Beal Kelly S | -- | -- |
Source: Public Records
Mortgage History
| Date | Status | Borrower | Loan Amount |
|---|---|---|---|
| Open | Khan Mir Faheem | $255,000 | |
| Previous Owner | Hamilton Heather M | $185,250 |
Source: Public Records
Tax History Compared to Growth
Tax History
| Year | Tax Paid | Tax Assessment Tax Assessment Total Assessment is a certain percentage of the fair market value that is determined by local assessors to be the total taxable value of land and additions on the property. | Land | Improvement |
|---|---|---|---|---|
| 2024 | $2,717 | $356,545 | -- | $356,545 |
| 2023 | $2,717 | $346,161 | $0 | $346,161 |
| 2022 | $2,657 | $336,079 | $0 | $336,079 |
| 2021 | $2,616 | $108,764 | $0 | $108,764 |
| 2020 | $1,862 | $77,501 | $0 | $77,501 |
| 2019 | $1,836 | $75,244 | $0 | $75,244 |
| 2018 | $1,796 | $73,052 | $0 | $73,052 |
| 2017 | $1,751 | $70,925 | $0 | $70,925 |
| 2016 | $1,651 | $68,859 | $0 | $68,859 |
| 2015 | $1,612 | $66,854 | $0 | $66,854 |
| 2014 | $1,516 | $64,842 | $0 | $64,842 |
Source: Public Records
Map
Nearby Homes
- 663 Bishops Lodge Rd Unit 24
- 321 Callecita Place
- 101 Callecita Place Unit 1,2,3
- 224 Artist Rd Unit 1
- 227 Artist Rd
- 104 Camino Matias Unit Lot 29
- 112 A&B Camino Mattias
- 107 A&B Camino Santiago Unit Lot 4
- 105 A&B Camino Santiago Unit Lot 3
- 110 A&B Camino Santiago
- 111 Camino Matias
- 320 Artist Rd Unit 14
- 320 Artist Rd Unit 12
- 320 Artist Rd Unit 95
- 320 Artist Rd Unit 89
- 320 Artist Rd Unit 52
- 320 Artist Rd Unit 8
- 320 Artist Rd Unit 58
- 335 Otero St
- 333 Magdalena Rd
- 663 Bishops Lodge Rd
- 663 Bishops Lodge Rd
- 663 Bishops Lodge Rd
- 663 Bishops Lodge Rd
- 663 Bishops Lodge Rd
- 663 Bishops Lodge Rd
- 663 Bishops Lodge Rd
- 663 Bishops Lodge Rd
- 663 Bishops Lodge Rd
- 663 Bishops Lodge Rd
- 663 Bishops Lodge Rd
- 663 Bishops Lodge Rd
- 663 Bishops Lodge Rd
- 663 Bishops Lodge Rd
- 663 Bishops Lodge Rd
- 663 Bishops Lodge Rd Unit 61
- 663 Bishops Lodge Rd
- 663 Bishops Lodge Rd
- 663 Bishops Lodge Rd
- 663 Bishops Lodge Rd