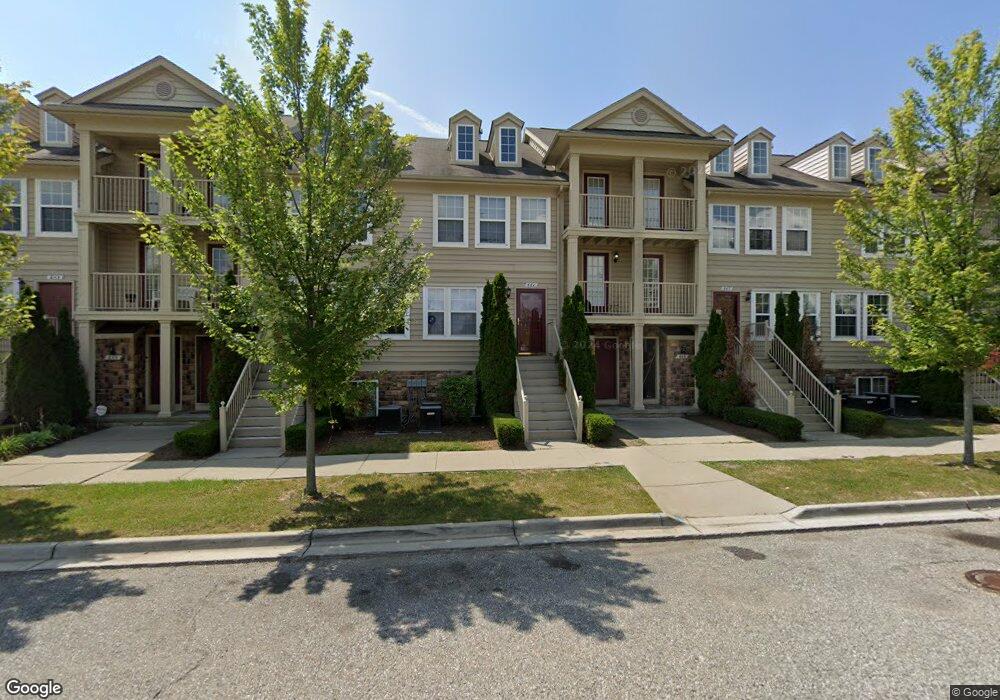
663 Lewa Downs Dr Unit M Pontiac, MI 48341
Estimated Value: $131,000 - $146,000
2
Beds
2
Baths
1,346
Sq Ft
$101/Sq Ft
Est. Value
About This Home
This home is located at 663 Lewa Downs Dr Unit M, Pontiac, MI 48341 and is currently estimated at $135,631, approximately $100 per square foot. 663 Lewa Downs Dr Unit M is a home located in Oakland County with nearby schools including Walt Whitman Elementary School, Pontiac Middle School, and Pontiac High School.
Ownership History
Date
Name
Owned For
Owner Type
Purchase Details
Closed on
Jan 26, 2015
Sold by
Smith William
Bought by
Smith William and Jones Frank
Current Estimated Value
Purchase Details
Closed on
Oct 29, 2013
Sold by
Ahouanhoun Helga and Womeku Marcellin D
Bought by
Smith William
Purchase Details
Closed on
Dec 29, 2009
Sold by
Enderle Ross
Bought by
Federal Home Loan Mortgage Corp
Purchase Details
Closed on
Nov 30, 2006
Sold by
Neumann Homes Of Michigan Llc
Bought by
Enderle Ross
Home Financials for this Owner
Home Financials are based on the most recent Mortgage that was taken out on this home.
Original Mortgage
$77,625
Interest Rate
6.36%
Mortgage Type
Purchase Money Mortgage
Purchase Details
Closed on
Jun 5, 2003
Sold by
Eltel Associates Llc
Bought by
The Village At Stonegate Pointe Llc
Create a Home Valuation Report for This Property
The Home Valuation Report is an in-depth analysis detailing your home's value as well as a comparison with similar homes in the area
Home Values in the Area
Average Home Value in this Area
Purchase History
| Date | Buyer | Sale Price | Title Company |
|---|---|---|---|
| Smith William | -- | None Available | |
| Smith William | $48,900 | None Available | |
| Federal Home Loan Mortgage Corp | $28,000 | None Available | |
| Enderle Ross | $103,500 | None Available | |
| The Village At Stonegate Pointe Llc | -- | Metropolitan |
Source: Public Records
Mortgage History
| Date | Status | Borrower | Loan Amount |
|---|---|---|---|
| Previous Owner | Enderle Ross | $77,625 |
Source: Public Records
Tax History Compared to Growth
Tax History
| Year | Tax Paid | Tax Assessment Tax Assessment Total Assessment is a certain percentage of the fair market value that is determined by local assessors to be the total taxable value of land and additions on the property. | Land | Improvement |
|---|---|---|---|---|
| 2024 | $1,251 | $60,330 | $0 | $0 |
| 2023 | $1,192 | $54,730 | $0 | $0 |
| 2022 | $2,623 | $43,430 | $0 | $0 |
| 2021 | $2,202 | $38,820 | $0 | $0 |
| 2020 | $1,083 | $36,320 | $0 | $0 |
| 2019 | $1,099 | $31,660 | $0 | $0 |
| 2018 | $1,077 | $29,430 | $0 | $0 |
| 2017 | $1,028 | $27,580 | $0 | $0 |
| 2016 | $1,020 | $22,350 | $0 | $0 |
| 2015 | -- | $17,280 | $0 | $0 |
| 2014 | -- | $14,160 | $0 | $0 |
| 2011 | -- | $23,030 | $0 | $0 |
Source: Public Records
Map
Nearby Homes
- 642 Lydia Ln Unit 54
- 253 Lasseigne St
- 247 Lasseigne St
- 331 Elizabeth Lake Rd
- 321 Tom Ave Unit 70
- 94 Dwight Ave
- 50 Waldo St
- 65 Dwight Ave
- 14 Utica Rd
- 129 Osceola Dr
- 88 Thorpe St
- V/L W Huron St
- 39 Osceola Dr
- 34 Liberty St
- 35 Liberty St
- 832 W Huron St
- 22 Cooley St
- 73 Henderson St
- 122 N Tilden Ave
- 205 Florence St
- 661 Lewa Downs Dr
- 634 Lydia Ln Unit Bldg-Unit
- 614 Lydia Ln Unit Bldg-Unit
- 627 Lewa Downs Dr Unit 7, 80
- 675 Lewa Downs Dr Unit 9, 104
- 633 Lewa Downs Dr Unit 8, 83
- 675 Lewa Downs Dr Unit 104
- 673 Lewa Downs Dr Unit 103
- 671 Lewa Downs Dr Unit 102
- 669 Lewa Downs Dr Unit 101
- 667 Lewa Downs Dr Unit 100
- 665 Lewa Downs Dr Unit 99
- 659 Lewa Downs Dr
- 657 Lewa Downs Dr Unit 95
- 655 Lewa Downs Dr Unit 94
- 651 Lewa Downs Dr Unit 92
- 647 Lewa Downs Dr
- 645 Lewa Downs Dr
- 643 Lewa Downs Dr Unit 88
- 641 Lewa Downs Dr Unit 87