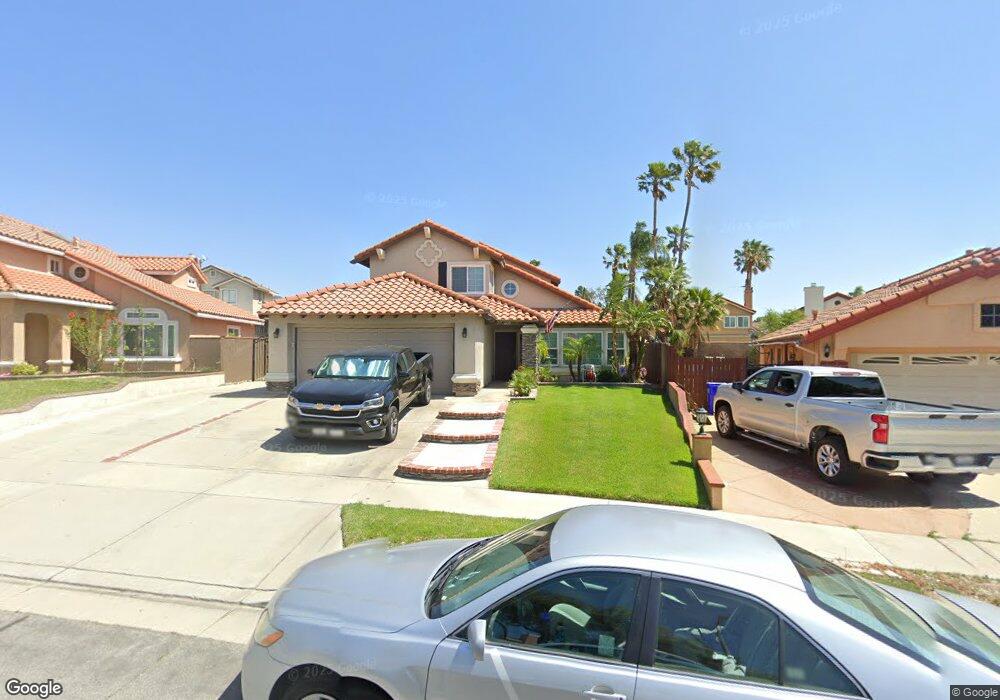
6639 Ventura Place Rancho Cucamonga, CA 91701
Estimated Value: $875,000 - $887,000
4
Beds
3
Baths
1,895
Sq Ft
$464/Sq Ft
Est. Value
About This Home
This home is located at 6639 Ventura Place, Rancho Cucamonga, CA 91701 and is currently estimated at $879,708, approximately $464 per square foot. 6639 Ventura Place is a home located in San Bernardino County with nearby schools including Banyan Elementary, Vineyard Junior High, and Los Osos High.
Ownership History
Date
Name
Owned For
Owner Type
Purchase Details
Closed on
Nov 23, 2007
Sold by
Fremont Investment & Loan
Bought by
Barra John E and Barra Noreen R
Current Estimated Value
Home Financials for this Owner
Home Financials are based on the most recent Mortgage that was taken out on this home.
Original Mortgage
$265,000
Outstanding Balance
$166,627
Interest Rate
6.26%
Mortgage Type
Purchase Money Mortgage
Estimated Equity
$713,081
Purchase Details
Closed on
Sep 13, 2007
Sold by
Mesquita Reinaldo
Bought by
Fremont Investment & Loan
Purchase Details
Closed on
Aug 11, 2004
Sold by
Mesquita Reinaldo and Mesquita Luciana
Bought by
Mesquita Reinaldo
Purchase Details
Closed on
Sep 25, 2003
Sold by
Mesquita Reinaldo
Bought by
Mesquita Reinaldo and Mesquita Luciana
Home Financials for this Owner
Home Financials are based on the most recent Mortgage that was taken out on this home.
Original Mortgage
$315,000
Interest Rate
6.22%
Mortgage Type
Purchase Money Mortgage
Purchase Details
Closed on
Oct 22, 2001
Sold by
Mesquita Luciana Demoura
Bought by
Mesquita Reinaldo
Home Financials for this Owner
Home Financials are based on the most recent Mortgage that was taken out on this home.
Original Mortgage
$229,500
Interest Rate
6.84%
Purchase Details
Closed on
Oct 4, 2001
Sold by
Tse Jimmy Shun Moon and Tse Janice Fung Kuen
Bought by
Mesquita Reinaldo
Home Financials for this Owner
Home Financials are based on the most recent Mortgage that was taken out on this home.
Original Mortgage
$229,500
Interest Rate
6.84%
Purchase Details
Closed on
Aug 7, 2001
Sold by
Horton Robert Laird and Horton Pamela Ann
Bought by
Tse Jimmy Shun Moon and Tse Janice Fung Kuen
Home Financials for this Owner
Home Financials are based on the most recent Mortgage that was taken out on this home.
Original Mortgage
$229,500
Interest Rate
6.84%
Purchase Details
Closed on
Sep 23, 1998
Sold by
Ann Horton Robert L and Ann Pamela
Bought by
Horton Robert Laird and Horton Pamela Ann
Home Financials for this Owner
Home Financials are based on the most recent Mortgage that was taken out on this home.
Original Mortgage
$147,000
Interest Rate
6.88%
Purchase Details
Closed on
Jan 2, 1997
Sold by
Horton Robert L
Bought by
Horton Robert Laird and Horton Pamela Ann
Purchase Details
Closed on
Mar 9, 1995
Sold by
Horton Cynthia Ann
Bought by
Horton Robert Laird
Create a Home Valuation Report for This Property
The Home Valuation Report is an in-depth analysis detailing your home's value as well as a comparison with similar homes in the area
Home Values in the Area
Average Home Value in this Area
Purchase History
| Date | Buyer | Sale Price | Title Company |
|---|---|---|---|
| Barra John E | $455,000 | First American Title Ins Co | |
| Fremont Investment & Loan | $432,264 | Alliance Title Company | |
| Mesquita Reinaldo | -- | Old Republic Title Company | |
| Mesquita Reinaldo | -- | Old Republic Title Company | |
| Mesquita Reinaldo | -- | New Century Title Company | |
| Mesquita Reinaldo | -- | American Title Co | |
| Mesquita Reinaldo | $255,000 | American Title Co | |
| Tse Jimmy Shun Moon | -- | American Title Co | |
| Horton Robert Laird | -- | First American Title Ins Co | |
| Horton Robert Laird | -- | -- | |
| Horton Robert Laird | -- | -- |
Source: Public Records
Mortgage History
| Date | Status | Borrower | Loan Amount |
|---|---|---|---|
| Open | Barra John E | $265,000 | |
| Previous Owner | Mesquita Reinaldo | $315,000 | |
| Previous Owner | Mesquita Reinaldo | $229,500 | |
| Previous Owner | Tse Jimmy Shun Moon | $90,000 | |
| Previous Owner | Horton Robert Laird | $147,000 |
Source: Public Records
Tax History Compared to Growth
Tax History
| Year | Tax Paid | Tax Assessment Tax Assessment Total Assessment is a certain percentage of the fair market value that is determined by local assessors to be the total taxable value of land and additions on the property. | Land | Improvement |
|---|---|---|---|---|
| 2025 | $7,336 | $656,761 | $197,028 | $459,733 |
| 2024 | $7,336 | $643,884 | $193,165 | $450,719 |
| 2023 | $7,166 | $631,258 | $189,377 | $441,881 |
| 2022 | $7,137 | $618,881 | $185,664 | $433,217 |
| 2021 | $7,133 | $606,747 | $182,024 | $424,723 |
| 2020 | $6,850 | $600,526 | $180,158 | $420,368 |
| 2019 | $6,924 | $588,750 | $176,625 | $412,125 |
| 2018 | $6,774 | $577,206 | $173,162 | $404,044 |
| 2017 | $6,184 | $539,200 | $188,600 | $350,600 |
| 2016 | $5,857 | $513,500 | $179,600 | $333,900 |
| 2015 | $5,637 | $489,000 | $171,000 | $318,000 |
| 2014 | $5,596 | $489,000 | $171,000 | $318,000 |
Source: Public Records
Map
Nearby Homes
- 6572 San Benito Ave
- 10980 Santa Barbara Place
- 6516 Alameda Ave
- 10672 Finch Ave
- 6915 Stanislaus Place
- 11027 Furman Ct
- 10655 Lemon Ave Unit 3613
- 10655 Lemon Ave Unit 3808
- 10655 Lemon Ave Unit 4004
- 10655 Lemon Ave Unit 1710
- 10655 Lemon Ave Unit 4009
- 10655 Lemon Ave Unit 1508
- 10655 Lemon Ave Unit 2402
- 10655 Lemon Ave Unit 3912
- 6792 Galveston Place
- 6842 Palm Dr
- 11017 Piedmont St
- 6831 Valinda Ave
- 6886 Cabrini Ct
- 11344 Sunrise Ct
- 6645 Ventura Place
- 6635 Ventura Place
- 6628 San Benito Ave
- 6632 San Benito Ave
- 6655 Ventura Place
- 6625 Ventura Place
- 6642 San Benito Ave
- 6622 San Benito Ave
- 6652 San Benito Ave
- 6612 San Benito Ave
- 6662 San Benito Ave
- 6665 Ventura Place
- 6619 Ventura Place
- 6634 Ventura Place
- 6644 Ventura Place
- 6668 San Benito Ave
- 6602 San Benito Ave
- 6654 Ventura Place
- 6624 Ventura Place
- 6615 Ventura Place