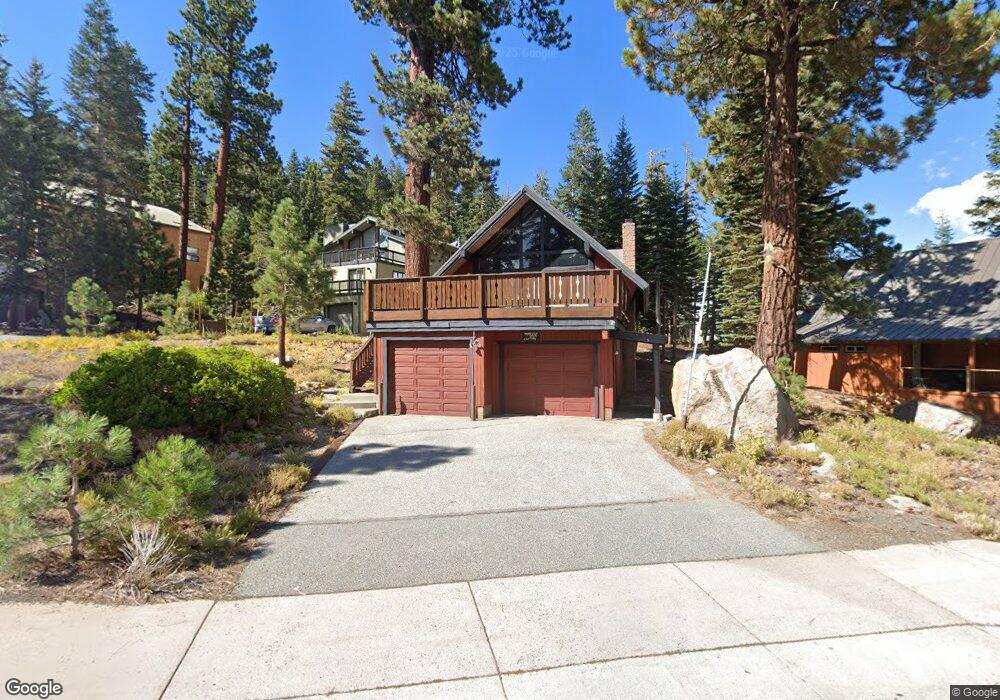
664 Canyon Blvd Mammoth Lakes, CA 93546
Estimated Value: $1,041,652 - $1,563,000
2
Beds
2
Baths
1,681
Sq Ft
$745/Sq Ft
Est. Value
About This Home
This home is located at 664 Canyon Blvd, Mammoth Lakes, CA 93546 and is currently estimated at $1,253,163, approximately $745 per square foot. 664 Canyon Blvd is a home with nearby schools including Mammoth Elementary School, Mammoth Middle School, and Mammoth High School.
Ownership History
Date
Name
Owned For
Owner Type
Purchase Details
Closed on
Mar 8, 2024
Sold by
Robert E Francis Revocable Trust and Rymer Charles
Bought by
Tims Andrew
Current Estimated Value
Purchase Details
Closed on
Jul 3, 2014
Sold by
Rymer Devon
Bought by
Eisele Gregory S
Home Financials for this Owner
Home Financials are based on the most recent Mortgage that was taken out on this home.
Original Mortgage
$125,000
Interest Rate
4.17%
Mortgage Type
Credit Line Revolving
Purchase Details
Closed on
Jun 9, 2014
Sold by
Skinner Danielle
Bought by
Francis Robert E
Home Financials for this Owner
Home Financials are based on the most recent Mortgage that was taken out on this home.
Original Mortgage
$125,000
Interest Rate
4.17%
Mortgage Type
Credit Line Revolving
Purchase Details
Closed on
Apr 14, 2012
Sold by
Tims Linda L
Bought by
Linda L Tims Revocable Trust
Create a Home Valuation Report for This Property
The Home Valuation Report is an in-depth analysis detailing your home's value as well as a comparison with similar homes in the area
Home Values in the Area
Average Home Value in this Area
Purchase History
| Date | Buyer | Sale Price | Title Company |
|---|---|---|---|
| Tims Andrew | -- | None Listed On Document | |
| Eisele Gregory S | $106,000 | None Available | |
| Francis Robert E | $106,000 | Chicago Title Company | |
| Skinner Danielle | -- | Inyo Mono Title Company | |
| Rymer Devon | -- | Inyo Mono Title Company | |
| Francis Robert E | -- | Inyo Mono Title Company | |
| Linda L Tims Revocable Trust | -- | None Available |
Source: Public Records
Mortgage History
| Date | Status | Borrower | Loan Amount |
|---|---|---|---|
| Previous Owner | Francis Robert E | $125,000 |
Source: Public Records
Tax History Compared to Growth
Tax History
| Year | Tax Paid | Tax Assessment Tax Assessment Total Assessment is a certain percentage of the fair market value that is determined by local assessors to be the total taxable value of land and additions on the property. | Land | Improvement |
|---|---|---|---|---|
| 2024 | $6,898 | $488,682 | $169,683 | $318,999 |
| 2023 | $6,898 | $479,101 | $166,356 | $312,745 |
| 2022 | $5,465 | $469,708 | $163,095 | $306,613 |
| 2021 | $5,312 | $460,499 | $159,898 | $300,601 |
| 2020 | $5,272 | $455,778 | $158,259 | $297,519 |
| 2019 | $5,155 | $446,842 | $155,156 | $291,686 |
| 2018 | $5,200 | $438,081 | $152,114 | $285,967 |
| 2017 | $4,805 | $429,492 | $149,132 | $280,360 |
| 2016 | $6,460 | $578,692 | $203,050 | $375,642 |
| 2015 | $6,431 | $570,000 | $200,000 | $370,000 |
| 2014 | $3,150 | $274,166 | $97,680 | $176,486 |
Source: Public Records
Map
Nearby Homes
- 757 Canyon Blvd Unit 26
- 248 Mammoth Slopes Dr Unit 23
- 248 Mammoth Slopes Dr Unit 80
- 248 Mammoth Slopes Dr Unit D-32
- 98 Aspen Ln
- 98 Aspen Ln Unit 9
- 360 Rainbow Ln Unit 84
- 464 Canyon Blvd Unit 133
- 808 Canyon Blvd Unit 107
- 66 Jahan Dr Unit 16
- 66 Jahan Dr
- 2131 Forest Trail Unit 61
- 895 Canyon Blvd Unit 49
- 895 Canyon Blvd Unit St Anton 66
- 75 Crystal Ln Unit 71
- 435 Lakeview Blvd Unit 47
- 435 Lakeview Blvd Unit 91
- 826 Lakeview Blvd Unit 592
- 306 Davison Rd Unit Lot 11
- 125 Davison Unit 1
- 652 Canyon Blvd
- 674 Canyon Place Unit 92
- 674 Canyon Place
- 1788 Forest Trail Unit 95
- 1788 Forest Trail
- 682 Canyon Place Unit 91
- 663 Canyon Blvd
- 651 Canyon Blvd Unit 85
- 651 Canyon Blvd Unit Mammoth Slopes III L
- 692 Canyon Place Unit 90
- 692 Canyon Place
- 700 Canyon Blvd Unit Mammoth Slopes III l
- 692 Canyon Place Lot #90 Unit 90
- 679 Canyon Blvd Unit 87
- 679 Canyon Blvd
- 1793 Forest Trail
- 691 Canyon Blvd
- 691 Canyon Blvd Unit MS III 88
- 1770 Forest Trail
- 114 Rainbow Ln