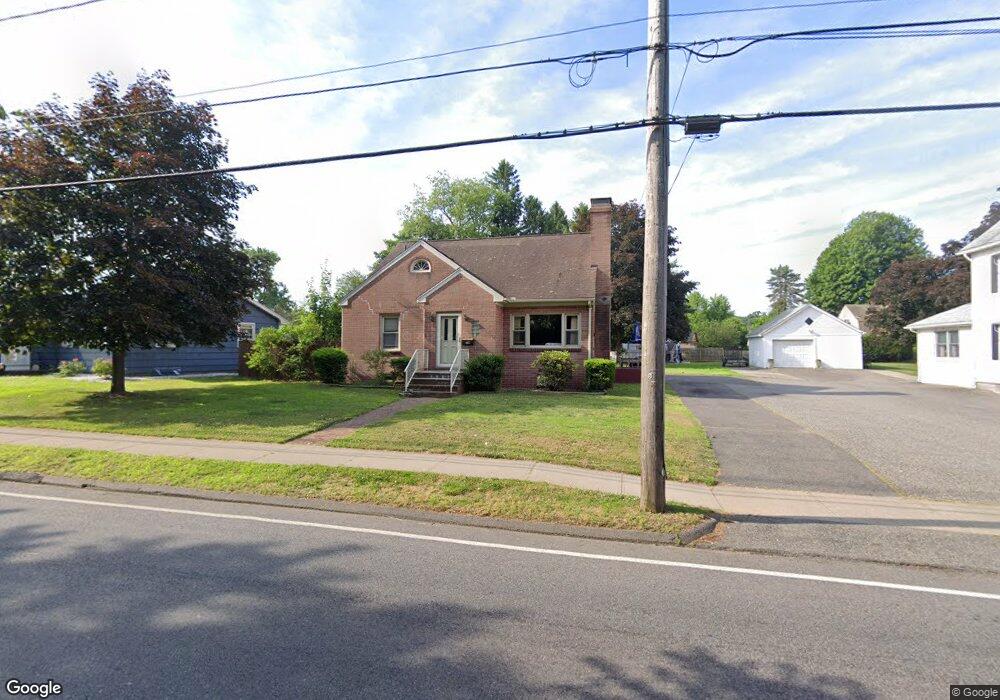
664 E Main St Chicopee, MA 01020
Chicopee Falls NeighborhoodEstimated Value: $349,172 - $415,000
4
Beds
1
Bath
1,876
Sq Ft
$205/Sq Ft
Est. Value
About This Home
This home is located at 664 E Main St, Chicopee, MA 01020 and is currently estimated at $383,793, approximately $204 per square foot. 664 E Main St is a home located in Hampden County with nearby schools including Belcher Elementary School, Bellamy Middle School, and Chicopee High School.
Ownership History
Date
Name
Owned For
Owner Type
Purchase Details
Closed on
Oct 31, 2006
Sold by
Oneill Roy F and Oneill Robert W
Bought by
Oneill Roy F
Current Estimated Value
Home Financials for this Owner
Home Financials are based on the most recent Mortgage that was taken out on this home.
Original Mortgage
$184,000
Outstanding Balance
$110,482
Interest Rate
6.48%
Mortgage Type
Purchase Money Mortgage
Estimated Equity
$273,311
Create a Home Valuation Report for This Property
The Home Valuation Report is an in-depth analysis detailing your home's value as well as a comparison with similar homes in the area
Home Values in the Area
Average Home Value in this Area
Purchase History
| Date | Buyer | Sale Price | Title Company |
|---|---|---|---|
| Oneill Roy F | -- | -- |
Source: Public Records
Mortgage History
| Date | Status | Borrower | Loan Amount |
|---|---|---|---|
| Open | Oneill Roy F | $184,000 |
Source: Public Records
Tax History
| Year | Tax Paid | Tax Assessment Tax Assessment Total Assessment is a certain percentage of the fair market value that is determined by local assessors to be the total taxable value of land and additions on the property. | Land | Improvement |
|---|---|---|---|---|
| 2025 | $4,487 | $296,000 | $101,200 | $194,800 |
| 2024 | $4,252 | $288,100 | $99,200 | $188,900 |
| 2023 | $4,068 | $268,500 | $90,100 | $178,400 |
| 2022 | $3,977 | $234,100 | $78,400 | $155,700 |
| 2021 | $3,758 | $213,400 | $71,300 | $142,100 |
| 2020 | $3,560 | $203,900 | $71,300 | $132,600 |
| 2019 | $3,499 | $194,800 | $71,300 | $123,500 |
| 2018 | $3,395 | $185,400 | $67,900 | $117,500 |
| 2017 | $3,034 | $175,300 | $67,900 | $107,400 |
| 2016 | $2,914 | $172,300 | $67,900 | $104,400 |
| 2015 | $3,031 | $172,800 | $67,900 | $104,900 |
| 2014 | $1,515 | $172,800 | $67,900 | $104,900 |
Source: Public Records
Map
Nearby Homes
- 66 Bromont St
- 74 Woodstock St
- 30 Butler Ave
- 70 Chateaugay St
- 104 Chateaugay St
- 251 Edendale St
- 156 East St
- 225 Osborne Terrace
- 181 Beauchamp Terrace
- 147 Bowles Park
- 238 E Main St
- 101 Huntington Ave
- 95 Washington St
- 173 Russell St
- 41 Oakhill Cir Unit 41
- 112 W Canton Cir
- 26 Belcher St
- 23 Jackson St
- 38 Tyrone St
- 109 Church St
- 672 E Main St
- 652 E Main St
- 680 E Main St
- 646 E Main St
- 26 Baltimore Ave
- 21 New York Ave
- 32 Baltimore Ave
- 27 New York Ave
- 634 E Main St
- 690 E Main St
- 44 Baltimore Ave
- 16 New York Ave
- 15 Baltimore Ave
- 23 Baltimore Ave
- 33 Baltimore Ave
- 24 New York Ave
- 29 Baltimore Ave
- 626 E Main St
- 694 E Main St
- 30 New York Ave