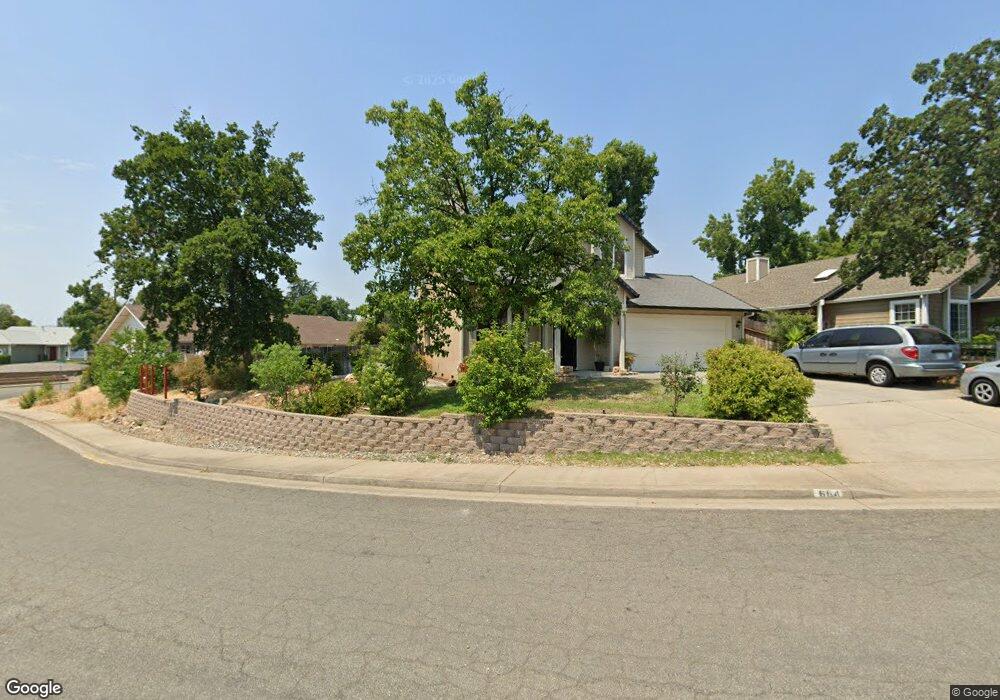
664 Saint Thomas Pkwy Redding, CA 96003
North Hilltop NeighborhoodEstimated Value: $372,000 - $403,000
3
Beds
3
Baths
1,701
Sq Ft
$226/Sq Ft
Est. Value
About This Home
This home is located at 664 Saint Thomas Pkwy, Redding, CA 96003 and is currently estimated at $384,426, approximately $226 per square foot. 664 Saint Thomas Pkwy is a home located in Shasta County with nearby schools including Turtle Bay, Sequoia Middle School, and Shasta High School.
Ownership History
Date
Name
Owned For
Owner Type
Purchase Details
Closed on
Jun 1, 2017
Sold by
Chao Philip Waancdouc and Chao Somneuk
Bought by
Culver Matthew A and Mu Yanying
Current Estimated Value
Home Financials for this Owner
Home Financials are based on the most recent Mortgage that was taken out on this home.
Original Mortgage
$256,155
Outstanding Balance
$213,648
Interest Rate
4.12%
Mortgage Type
FHA
Estimated Equity
$170,778
Purchase Details
Closed on
Feb 5, 2013
Sold by
Equitable Investments
Bought by
Chao Philip Waancdouc and Chao Somneuk
Home Financials for this Owner
Home Financials are based on the most recent Mortgage that was taken out on this home.
Original Mortgage
$206,196
Interest Rate
3.32%
Mortgage Type
FHA
Purchase Details
Closed on
Sep 17, 2012
Sold by
Malmsten Neal R
Bought by
Equitable Investments
Purchase Details
Closed on
Oct 26, 2005
Sold by
Hayes Vera E
Bought by
Malmsten Neal R
Home Financials for this Owner
Home Financials are based on the most recent Mortgage that was taken out on this home.
Original Mortgage
$67,140
Interest Rate
5.68%
Mortgage Type
Stand Alone Second
Create a Home Valuation Report for This Property
The Home Valuation Report is an in-depth analysis detailing your home's value as well as a comparison with similar homes in the area
Home Values in the Area
Average Home Value in this Area
Purchase History
| Date | Buyer | Sale Price | Title Company |
|---|---|---|---|
| Culver Matthew A | $265,000 | Fidelity Natl Title Co Of Ca | |
| Chao Philip Waancdouc | $210,000 | First American Title Company | |
| Equitable Investments | $158,800 | None Available | |
| Malmsten Neal R | $336,000 | Alliance Title Company |
Source: Public Records
Mortgage History
| Date | Status | Borrower | Loan Amount |
|---|---|---|---|
| Open | Culver Matthew A | $256,155 | |
| Previous Owner | Chao Philip Waancdouc | $206,196 | |
| Previous Owner | Malmsten Neal R | $67,140 | |
| Previous Owner | Malmsten Neal R | $268,560 |
Source: Public Records
Tax History
| Year | Tax Paid | Tax Assessment Tax Assessment Total Assessment is a certain percentage of the fair market value that is determined by local assessors to be the total taxable value of land and additions on the property. | Land | Improvement |
|---|---|---|---|---|
| 2025 | $3,256 | $307,549 | $63,829 | $243,720 |
| 2024 | $3,208 | $301,520 | $62,578 | $238,942 |
| 2023 | $3,208 | $295,608 | $61,351 | $234,257 |
| 2022 | $3,155 | $289,813 | $60,149 | $229,664 |
| 2021 | $3,141 | $284,131 | $58,970 | $225,161 |
| 2020 | $3,182 | $281,219 | $58,366 | $222,853 |
| 2019 | $3,024 | $275,706 | $57,222 | $218,484 |
| 2018 | $3,051 | $270,300 | $56,100 | $214,200 |
| 2017 | $2,491 | $222,814 | $42,439 | $180,375 |
| 2016 | $2,413 | $218,446 | $41,607 | $176,839 |
| 2015 | $2,382 | $215,166 | $40,983 | $174,183 |
| 2014 | $2,365 | $210,952 | $40,181 | $170,771 |
Source: Public Records
Map
Nearby Homes
- 639 Alamine Dr
- 454 Alamine Dr
- 707 Alamine Dr
- 720 Stonebriar Trail
- 775 Stonebriar Trail
- 724 Oakhurst Trail
- 488 Ridgecrest Trail Unit 133
- 225 Ridgetop Dr Unit 214
- 200 Ridgetop Dr Unit 19
- 200 Ridgetop Dr Unit 31
- 651 Mission de Oro Dr
- 1026 Palisades Ave
- 856 Mission de Oro Dr
- 592 Mill Valley Pkwy
- 11037 Erickson Way
- 825 Mission Sierra Ct
- 771 Flower Ash Ln
- 531 Fair Hill Dr
- 481 Twin View Blvd
- 667 Reddington Dr
- 664 St Thomas Pkwy
- 650 Saint Thomas Pkwy
- 477 Dominica Ct
- 463 Dominica Ct
- 636 Saint Thomas Pkwy
- 449 Dominica Ct
- 671 Saint Thomas Pkwy Unit 1
- 671 Saint Thomas Pkwy Unit A
- 671 Saint Thomas Pkwy
- 677 Saint Thomas Pkwy
- 671 St Thomas Pkwy
- 695 St Thomas Pkwy
- 657 Saint Thomas Pkwy
- 0 Saint Thomas Pkwy
- 683 Saint Thomas Pkwy
- 622 St Thomas Pkwy
- 622 Saint Thomas Pkwy
- 643 Saint Thomas Pkwy Unit 1
- 643 Saint Thomas Pkwy
- 435 Dominica Ct
Your Personal Tour Guide
Ask me questions while you tour the home.