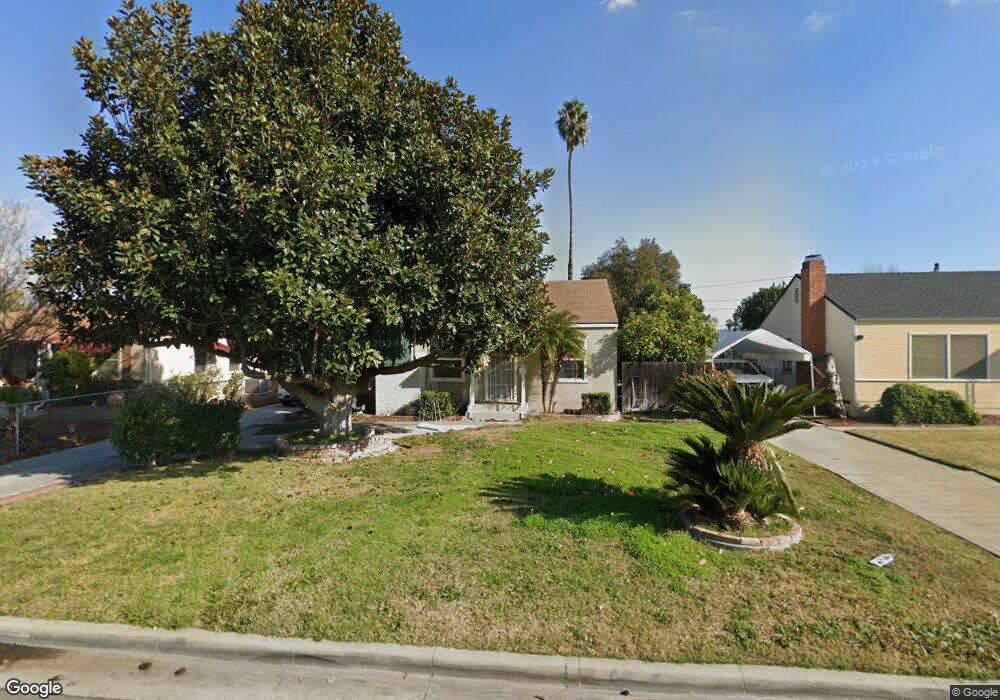
6640 Cumberland Ct Riverside, CA 92506
Magnolia Center NeighborhoodEstimated Value: $464,000 - $507,000
2
Beds
1
Bath
800
Sq Ft
$600/Sq Ft
Est. Value
About This Home
This home is located at 6640 Cumberland Ct, Riverside, CA 92506 and is currently estimated at $479,905, approximately $599 per square foot. 6640 Cumberland Ct is a home located in Riverside County with nearby schools including Madison Elementary School, Sierra Middle School, and Ramona High School.
Ownership History
Date
Name
Owned For
Owner Type
Purchase Details
Closed on
Feb 11, 2003
Sold by
Faust Erma Geraldine
Bought by
Faust Erma Geraldine and The Erma Geraldine Faust Separate Proper
Current Estimated Value
Purchase Details
Closed on
Jan 29, 2002
Sold by
Velasco Armando and Velasco Rachel
Bought by
Faust Geraldine
Purchase Details
Closed on
Feb 25, 1997
Sold by
Hud
Bought by
Velasco Armando and Velasco Rachel
Home Financials for this Owner
Home Financials are based on the most recent Mortgage that was taken out on this home.
Original Mortgage
$58,517
Interest Rate
7.63%
Mortgage Type
FHA
Purchase Details
Closed on
Aug 18, 1995
Sold by
Fleet Real Estate Funding Corp
Bought by
Hud
Purchase Details
Closed on
Aug 14, 1995
Sold by
Myers Kevin L and Myers Lisa L
Bought by
Fleet Real Estate Funding Corp
Create a Home Valuation Report for This Property
The Home Valuation Report is an in-depth analysis detailing your home's value as well as a comparison with similar homes in the area
Home Values in the Area
Average Home Value in this Area
Purchase History
| Date | Buyer | Sale Price | Title Company |
|---|---|---|---|
| Faust Erma Geraldine | -- | -- | |
| Faust Geraldine | $135,000 | First American Title Co | |
| Velasco Armando | $118,000 | Chicago Title Co | |
| Hud | -- | First Southwestern Title Co | |
| Fleet Real Estate Funding Corp | $85,137 | First Southwestern Title Co |
Source: Public Records
Mortgage History
| Date | Status | Borrower | Loan Amount |
|---|---|---|---|
| Previous Owner | Velasco Armando | $58,517 |
Source: Public Records
Tax History
| Year | Tax Paid | Tax Assessment Tax Assessment Total Assessment is a certain percentage of the fair market value that is determined by local assessors to be the total taxable value of land and additions on the property. | Land | Improvement |
|---|---|---|---|---|
| 2025 | $2,290 | $207,233 | $62,794 | $144,439 |
| 2023 | $2,290 | $199,187 | $60,356 | $138,831 |
| 2022 | $2,238 | $195,282 | $59,173 | $136,109 |
| 2021 | $2,220 | $191,454 | $58,013 | $133,441 |
| 2020 | $2,203 | $189,492 | $57,419 | $132,073 |
| 2019 | $2,163 | $185,778 | $56,294 | $129,484 |
| 2018 | $2,121 | $182,137 | $55,191 | $126,946 |
| 2017 | $2,084 | $178,566 | $54,109 | $124,457 |
| 2016 | $1,953 | $175,066 | $53,049 | $122,017 |
| 2015 | $1,925 | $172,438 | $52,253 | $120,185 |
| 2014 | $1,907 | $169,063 | $51,231 | $117,832 |
Source: Public Records
Map
Nearby Homes
- 4545 Sunnyside Dr
- 4791 Granada Ave
- 6979 Palm Ct Unit 126
- 6979 Palm Ct Unit 331
- 6979 Palm Ct
- 6979 Palm Ct Unit 319
- 6979 Palm Ct Unit 234
- 6240 Wiehe Ave
- 6688 Montclair Dr
- 6371 Lionel Ct
- 4660 Cover St
- 6342 Topeka Terrace
- 5025 Brooklawn Place
- 5033 Brooklawn Place
- 7328 Westwood Dr
- 5050 Brooklawn Place
- 4939 Plumtree Ct
- 5121 Sierra St
- 3683 Mckinley St
- 6090 Meadowbrook Ln
- 6632 Cumberland Ct
- 6641 Calvin Ct
- 6658 Cumberland Ct
- 6622 Cumberland Ct
- 6651 Calvin Ct
- 6633 Calvin Ct
- 6641 Cumberland Ct
- 6623 Calvin Ct
- 6659 Calvin Ct
- 6633 Cumberland Ct
- 6651 Cumberland Ct
- 6668 Cumberland Ct
- 6623 Cumberland Ct
- 6659 Cumberland Ct
- 4650 Central Ave
- 6671 Calvin Ct
- 4632 Central Ave
- 6669 Cumberland Ct
- 6676 Cumberland Ct
- 4678 Central Ave
Your Personal Tour Guide
Ask me questions while you tour the home.