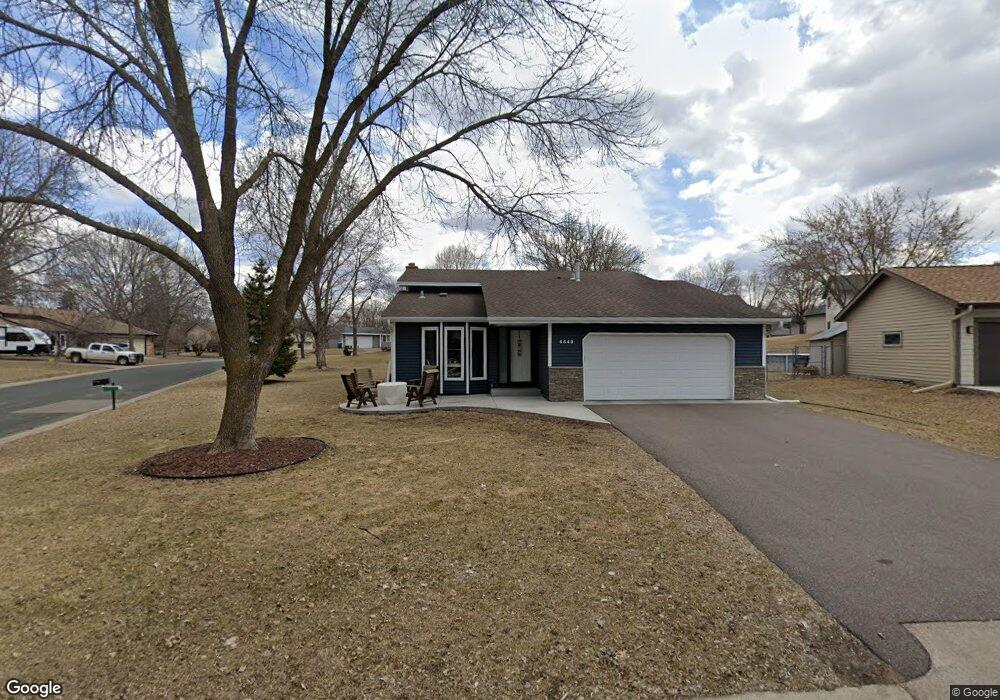
6640 Lancaster Ln N Maple Grove, MN 55369
Estimated Value: $381,000 - $418,000
3
Beds
2
Baths
1,122
Sq Ft
$353/Sq Ft
Est. Value
About This Home
This home is located at 6640 Lancaster Ln N, Maple Grove, MN 55369 and is currently estimated at $396,222, approximately $353 per square foot. 6640 Lancaster Ln N is a home located in Hennepin County with nearby schools including Cedar Island Elementary School, Maple Grove Middle School, and Osseo Senior High School.
Ownership History
Date
Name
Owned For
Owner Type
Purchase Details
Closed on
Sep 30, 2016
Sold by
Kapla John and Kapla Jennifer
Bought by
Miller Jason C and Miller Holly R
Current Estimated Value
Home Financials for this Owner
Home Financials are based on the most recent Mortgage that was taken out on this home.
Original Mortgage
$202,400
Outstanding Balance
$162,262
Interest Rate
3.46%
Mortgage Type
New Conventional
Estimated Equity
$233,960
Purchase Details
Closed on
Nov 20, 2014
Sold by
Kapla Thomas and Kapla Karen
Bought by
Kapla John and Kapla Jennifer
Home Financials for this Owner
Home Financials are based on the most recent Mortgage that was taken out on this home.
Original Mortgage
$206,000
Interest Rate
3.97%
Mortgage Type
New Conventional
Purchase Details
Closed on
May 19, 2009
Sold by
Hanson Robert and Hanson Judith A
Bought by
Hansen Jennifer and Kapia Jam
Purchase Details
Closed on
Sep 27, 2002
Sold by
Klapprich Terese Ann and Klapprich David P
Bought by
Roethler Dale A
Create a Home Valuation Report for This Property
The Home Valuation Report is an in-depth analysis detailing your home's value as well as a comparison with similar homes in the area
Home Values in the Area
Average Home Value in this Area
Purchase History
| Date | Buyer | Sale Price | Title Company |
|---|---|---|---|
| Miller Jason C | $253,000 | Trademark Title Services Inc | |
| Kapla John | -- | Titlesmart Inc | |
| Hansen Jennifer | $223,000 | -- | |
| Roethler Dale A | $186,000 | -- | |
| Hanson Robert C | $186,000 | -- |
Source: Public Records
Mortgage History
| Date | Status | Borrower | Loan Amount |
|---|---|---|---|
| Open | Miller Jason C | $202,400 | |
| Previous Owner | Kapla John | $206,000 | |
| Closed | Hanson Robert C | -- |
Source: Public Records
Tax History Compared to Growth
Tax History
| Year | Tax Paid | Tax Assessment Tax Assessment Total Assessment is a certain percentage of the fair market value that is determined by local assessors to be the total taxable value of land and additions on the property. | Land | Improvement |
|---|---|---|---|---|
| 2024 | $4,242 | $359,100 | $119,700 | $239,400 |
| 2023 | $4,060 | $350,300 | $105,400 | $244,900 |
| 2022 | $3,286 | $343,800 | $108,000 | $235,800 |
| 2021 | $3,267 | $280,100 | $57,300 | $222,800 |
| 2020 | $3,286 | $273,300 | $56,900 | $216,400 |
| 2019 | $3,027 | $263,700 | $55,000 | $208,700 |
| 2018 | $2,843 | $232,800 | $42,000 | $190,800 |
| 2017 | $2,809 | $207,100 | $42,000 | $165,100 |
| 2016 | $3,007 | $197,700 | $42,000 | $155,700 |
| 2015 | $3,012 | $193,200 | $42,000 | $151,200 |
| 2014 | -- | $193,900 | $61,000 | $132,900 |
Source: Public Records
Map
Nearby Homes
- 6640 Flag Ave N
- 6608 Edgemont Blvd N
- Lot 016 63rd Ave N
- 8924 66th Ave N
- 6325 Decatur Ave N
- 6242 Magda Dr Unit C
- 6408 Cavell Ave N
- 6314 Cavell Ct
- 8317 67th Ave N
- 7087 Wellington Ln N
- 11081 69th Ave N
- 8016 Aster Dr
- 11081 69th Place N
- 11053 N Eagle Lake Blvd
- 5900 Hillsboro Ave N
- 6040 Xylon Ave N
- 8416 Meadow Lake Rd N
- 5849 Boone Ave N
- 10120 57th Ave N
- 7916 61st Ave N
- 6590 Kilmer Way
- 6580 Kilmer Way
- 6647 Kilmer Way
- 6630 Lancaster Ln N
- 6637 Kilmer Way
- 6570 Kilmer Way
- 6635 Lancaster Ln N
- 6627 Kilmer Way
- 6560 Kilmer Way
- 6617 Kilmer Way
- 6655 Lancaster Ln N
- 6607 Kilmer Way
- 6625 Lancaster Ln N
- 6692 Lancaster Ln N
- 6597 Kilmer Way
- 6550 Kilmer Way
- 6690 Lancaster Ln N
- 6567 Kilmer Way
- 6694 Lancaster Ln N
- 6665 Lancaster Ln N