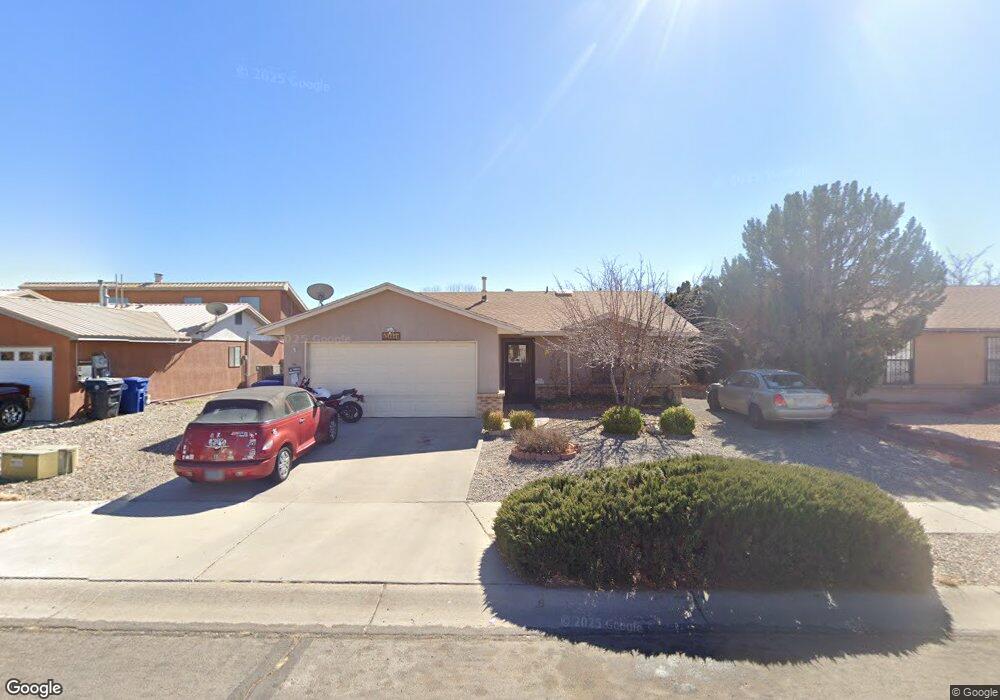
6642 Lamy St NW Albuquerque, NM 87120
Taylor Ranch NeighborhoodEstimated Value: $270,000 - $293,014
3
Beds
2
Baths
1,132
Sq Ft
$250/Sq Ft
Est. Value
About This Home
This home is located at 6642 Lamy St NW, Albuquerque, NM 87120 and is currently estimated at $283,504, approximately $250 per square foot. 6642 Lamy St NW is a home located in Bernalillo County with nearby schools including Marie M. Hughes Elementary School, L.B. Johnson Middle School, and Volcano Vista High School.
Ownership History
Date
Name
Owned For
Owner Type
Purchase Details
Closed on
Sep 19, 2011
Sold by
Jones Peck Margaret A and Peck Christopher S
Bought by
Morrow Road Llc
Current Estimated Value
Home Financials for this Owner
Home Financials are based on the most recent Mortgage that was taken out on this home.
Original Mortgage
$75,000
Outstanding Balance
$51,589
Interest Rate
4.43%
Mortgage Type
New Conventional
Estimated Equity
$231,915
Purchase Details
Closed on
Mar 25, 2005
Sold by
Peck Margaret A and Peck Christopher S
Bought by
Morrow Road Llc
Purchase Details
Closed on
Aug 1, 2003
Sold by
Lopez Alfredo and Lopez Rebecca V
Bought by
Peck Christopher S and Peck Margaret A
Home Financials for this Owner
Home Financials are based on the most recent Mortgage that was taken out on this home.
Original Mortgage
$84,400
Interest Rate
5.19%
Mortgage Type
Purchase Money Mortgage
Create a Home Valuation Report for This Property
The Home Valuation Report is an in-depth analysis detailing your home's value as well as a comparison with similar homes in the area
Home Values in the Area
Average Home Value in this Area
Purchase History
| Date | Buyer | Sale Price | Title Company |
|---|---|---|---|
| Morrow Road Llc | -- | Stewart Title | |
| Jones Peck Margaret A | -- | Stewart Title | |
| Morrow Road Llc | -- | -- | |
| Peck Christopher S | -- | Fidelity Natl Title Ins Co |
Source: Public Records
Mortgage History
| Date | Status | Borrower | Loan Amount |
|---|---|---|---|
| Open | Jones Peck Margaret A | $75,000 | |
| Previous Owner | Peck Christopher S | $84,400 |
Source: Public Records
Tax History Compared to Growth
Tax History
| Year | Tax Paid | Tax Assessment Tax Assessment Total Assessment is a certain percentage of the fair market value that is determined by local assessors to be the total taxable value of land and additions on the property. | Land | Improvement |
|---|---|---|---|---|
| 2025 | $2,188 | $53,408 | $12,074 | $41,334 |
| 2024 | $2,188 | $51,852 | $11,722 | $40,130 |
| 2023 | $2,151 | $50,342 | $11,381 | $38,961 |
| 2022 | $2,079 | $48,877 | $11,050 | $37,827 |
| 2021 | $2,009 | $47,453 | $10,728 | $36,725 |
| 2020 | $1,976 | $46,071 | $10,416 | $35,655 |
| 2019 | $1,918 | $44,730 | $10,113 | $34,617 |
| 2018 | $1,850 | $44,730 | $10,113 | $34,617 |
| 2017 | $1,793 | $43,427 | $9,818 | $33,609 |
| 2016 | $1,747 | $41,058 | $9,818 | $31,240 |
| 2015 | $39,862 | $39,862 | $9,532 | $30,330 |
| 2014 | $1,707 | $40,196 | $9,532 | $30,664 |
| 2013 | -- | $39,548 | $10,300 | $29,248 |
Source: Public Records
Map
Nearby Homes
- 5419 Timberline Ave NW
- 5429 Gold Rush Dr NW
- 5404 Territorial Rd NW
- 5305 Desert Sand Place NW
- 7104 Mojave St NW
- 6921 El Cajon Ct NW
- 6008 Open Sky Dr NW
- 6012 Open Sky Dr NW
- 6116 Agate Ave NW
- 6420 Pojoaque Rd NW
- 7300 Target Ln NW
- 5609 Cambria Rd NW
- 6101 Chimayo Dr NW
- 7413 Target Ln NW
- 6212 Prairie Sage Dr NW
- 4736 Galleta Rd NW
- 5432 Mariposa Dr NW
- 5136 Roanoke Ave NW
- 5901 Chimayo Dr NW
- 6005 Rio Pueblo Dr NW
- 6646 Lamy St NW
- 6638 Lamy St NW
- 5405 Timberline Ave NW
- 6650 Lamy St NW
- 6634 Lamy St NW
- 5401 Timberline Ave NW
- 5409 Timberline Ave NW
- 5323 Timberline Ave NW
- 6643 Lamy St NW
- 5415 Timberline Ave NW
- 6647 Lamy St NW
- 6639 Lamy St NW
- 6654 Lamy St NW
- 6630 Lamy St NW
- 6651 Lamy St NW
- 5319 Timberline Ave NW
- 6635 Lamy St NW
- 6655 Lamy St NW
- 6658 Lamy St NW
- 6626 Lamy St NW