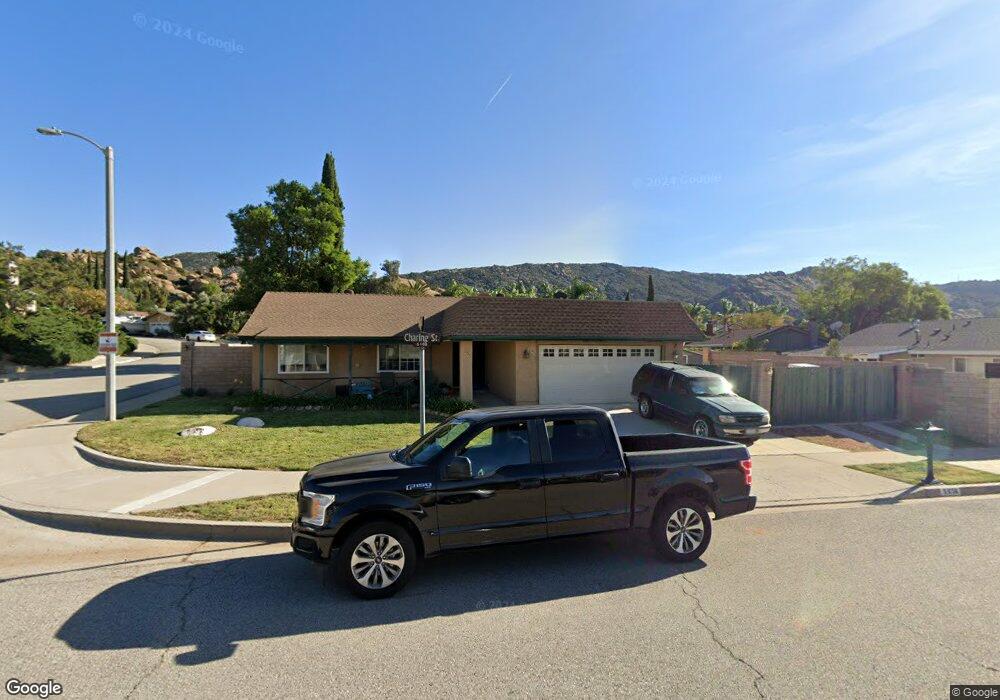
6656 Charing St Simi Valley, CA 93063
Estimated Value: $803,000 - $863,000
3
Beds
2
Baths
1,368
Sq Ft
$610/Sq Ft
Est. Value
About This Home
This home is located at 6656 Charing St, Simi Valley, CA 93063 and is currently estimated at $835,141, approximately $610 per square foot. 6656 Charing St is a home located in Ventura County with nearby schools including Knolls Elementary School, Valley View Middle School, and Simi Valley High School.
Ownership History
Date
Name
Owned For
Owner Type
Purchase Details
Closed on
Apr 23, 2019
Sold by
Adams Victor A and Adams Diane E Martinez
Bought by
Adams Victor A and Adams Diane E Martinez
Current Estimated Value
Home Financials for this Owner
Home Financials are based on the most recent Mortgage that was taken out on this home.
Original Mortgage
$392,000
Outstanding Balance
$339,578
Interest Rate
3.6%
Mortgage Type
New Conventional
Estimated Equity
$495,563
Purchase Details
Closed on
Dec 19, 2013
Sold by
Adams Victor A and Martinez Diane E
Bought by
Adams Victor A and Martinez Diane E
Home Financials for this Owner
Home Financials are based on the most recent Mortgage that was taken out on this home.
Original Mortgage
$324,000
Interest Rate
4.32%
Mortgage Type
New Conventional
Purchase Details
Closed on
Nov 8, 2010
Sold by
Wells Fargo Bank Na
Bought by
Adams Victor A and Martinez Adams Diane E
Home Financials for this Owner
Home Financials are based on the most recent Mortgage that was taken out on this home.
Original Mortgage
$303,920
Interest Rate
4.21%
Mortgage Type
New Conventional
Purchase Details
Closed on
Apr 29, 2010
Sold by
Olive Kevin Preston and Olive Sandra Annette
Bought by
Wells Fargo Bank Na
Purchase Details
Closed on
Jun 30, 2006
Sold by
Myers Dean C and Myers Sarah
Bought by
Olive Kevin Preston and Olive Sandra Annette
Home Financials for this Owner
Home Financials are based on the most recent Mortgage that was taken out on this home.
Original Mortgage
$117,000
Interest Rate
6.76%
Mortgage Type
Stand Alone Second
Purchase Details
Closed on
Aug 1, 2005
Sold by
Myers Dean C
Bought by
Myers Dean C and Myers Sarah
Home Financials for this Owner
Home Financials are based on the most recent Mortgage that was taken out on this home.
Original Mortgage
$320,000
Interest Rate
5.46%
Mortgage Type
New Conventional
Purchase Details
Closed on
Oct 8, 2004
Sold by
Myers Sarah R
Bought by
Myers Dean C
Home Financials for this Owner
Home Financials are based on the most recent Mortgage that was taken out on this home.
Original Mortgage
$267,000
Interest Rate
6.7%
Mortgage Type
New Conventional
Purchase Details
Closed on
Sep 16, 1998
Sold by
Kriz Anton J and Kriz Jan L
Bought by
Myers Dean C and Myers Sarah R
Home Financials for this Owner
Home Financials are based on the most recent Mortgage that was taken out on this home.
Original Mortgage
$174,193
Interest Rate
6.6%
Mortgage Type
FHA
Create a Home Valuation Report for This Property
The Home Valuation Report is an in-depth analysis detailing your home's value as well as a comparison with similar homes in the area
Home Values in the Area
Average Home Value in this Area
Purchase History
| Date | Buyer | Sale Price | Title Company |
|---|---|---|---|
| Adams Victor A | -- | Accommodation | |
| Adams Victor A | -- | Chicago Title Company | |
| Adams Victor A | $380,000 | Lsi Title Company | |
| Wells Fargo Bank Na | $506,758 | Accommodation | |
| Olive Kevin Preston | $585,000 | National Title Company | |
| Myers Dean C | -- | Fidelity National Title | |
| Myers Dean C | -- | Financial Title Company La | |
| Myers Dean C | $184,500 | First American Title Ins Co |
Source: Public Records
Mortgage History
| Date | Status | Borrower | Loan Amount |
|---|---|---|---|
| Open | Adams Victor A | $392,000 | |
| Closed | Adams Victor A | $324,000 | |
| Closed | Adams Victor A | $303,920 | |
| Previous Owner | Olive Kevin Preston | $117,000 | |
| Previous Owner | Olive Kevin Preston | $468,000 | |
| Previous Owner | Myers Dean C | $320,000 | |
| Previous Owner | Myers Dean C | $267,000 | |
| Previous Owner | Myers Dean C | $174,193 |
Source: Public Records
Tax History
| Year | Tax Paid | Tax Assessment Tax Assessment Total Assessment is a certain percentage of the fair market value that is determined by local assessors to be the total taxable value of land and additions on the property. | Land | Improvement |
|---|---|---|---|---|
| 2025 | $5,960 | $486,705 | $243,353 | $243,352 |
| 2024 | $5,960 | $477,162 | $238,581 | $238,581 |
| 2023 | $5,603 | $467,806 | $233,903 | $233,903 |
| 2022 | $5,579 | $458,634 | $229,317 | $229,317 |
| 2021 | $5,536 | $449,642 | $224,821 | $224,821 |
| 2020 | $5,420 | $445,034 | $222,517 | $222,517 |
| 2019 | $5,173 | $436,308 | $218,154 | $218,154 |
| 2018 | $5,128 | $427,754 | $213,877 | $213,877 |
| 2017 | $5,012 | $419,368 | $209,684 | $209,684 |
| 2016 | $4,787 | $411,146 | $205,573 | $205,573 |
| 2015 | $4,685 | $404,972 | $202,486 | $202,486 |
| 2014 | $4,694 | $397,040 | $198,520 | $198,520 |
Source: Public Records
Map
Nearby Homes
- 1744 Empty Saddle Rd
- 6755 Cowboy St
- 2128 Tremont Ave
- 2108 Ardenwood Ave
- 6435 Hazel Cir
- 6509 Twin Circle Ln Unit 7
- 6508 Twin Circle Ln Unit 1
- 6490 Twin Circle Ln
- 6542 Stoney View Ln
- 6442 Twin Circle Ln Unit 6
- 2178 Cheam Ave
- 2123 Cheam Ave
- 6334 Caroline Ave
- 6271 Marsha Ave
- 6289 Dana Ave
- 0 Not Yet Unit 225001783
- 6191 E Vera St
- 1575 River Wood Ct
- 6533 Canyon Oaks Dr
- 6532 Canyon Oaks Dr
- 1878 Charing Ct
- 1794 Tetlow Ave
- 1786 Tetlow Ave
- 6676 Charing St
- 1866 Charing Ct
- 6649 Charing St
- 1867 Charing Ct
- 6657 Charing St
- 1774 Tetlow Ave
- 6641 Charing St
- 6684 Charing St
- 1854 Charing Ct
- 6633 Charing St
- 1843 Charing Ct
- 6632 Charing St
- 6677 Charing St
- 6677 Sasparilla Dr
- 6689 Sasparilla Dr
- 6669 Sasparilla Dr
- 6648 Tapley Ct
Your Personal Tour Guide
Ask me questions while you tour the home.