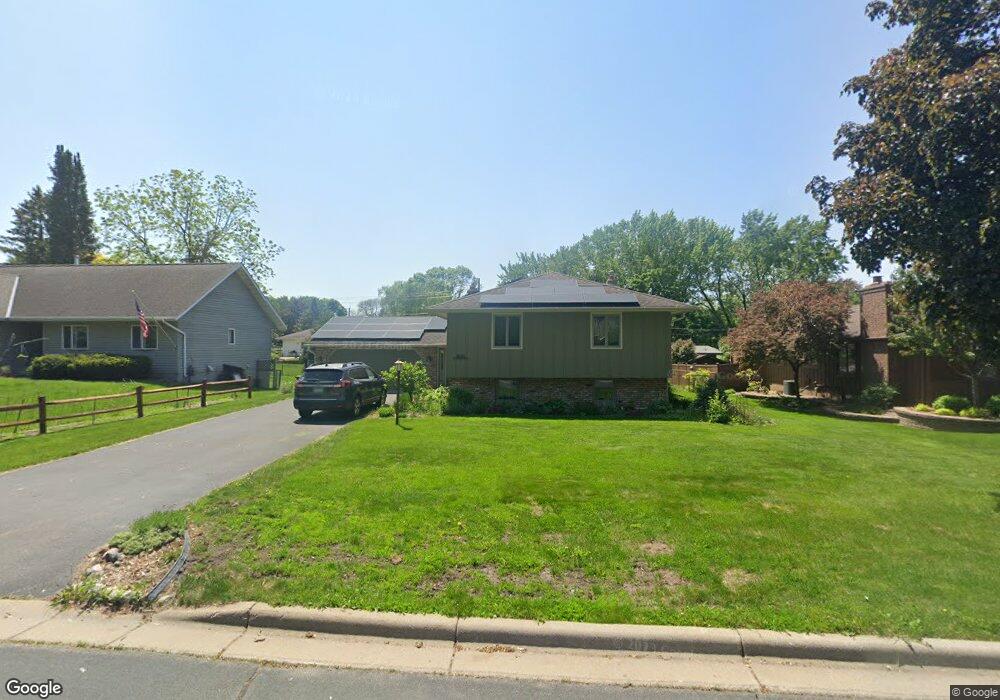
666 2nd Ave Saint Paul, MN 55118
Estimated Value: $421,000 - $462,000
3
Beds
3
Baths
1,531
Sq Ft
$288/Sq Ft
Est. Value
About This Home
This home is located at 666 2nd Ave, Saint Paul, MN 55118 and is currently estimated at $441,056, approximately $288 per square foot. 666 2nd Ave is a home located in Dakota County with nearby schools including Somerset Elementary School, Heritage E-STEM Magnet School, and Two Rivers High School.
Ownership History
Date
Name
Owned For
Owner Type
Purchase Details
Closed on
Jan 10, 2022
Sold by
Hoplin Sarah
Bought by
Nelson Dominic and Cerra Abigail
Current Estimated Value
Home Financials for this Owner
Home Financials are based on the most recent Mortgage that was taken out on this home.
Original Mortgage
$324,000
Outstanding Balance
$298,606
Interest Rate
3.11%
Mortgage Type
New Conventional
Estimated Equity
$142,450
Purchase Details
Closed on
Mar 13, 2018
Sold by
Hoplin David G and Hoplin Carol J
Bought by
Hoplin Sarah
Purchase Details
Closed on
Nov 20, 2015
Sold by
Hoffman Joan F and Hoffman Robert E
Bought by
David G Hoplin Trust
Home Financials for this Owner
Home Financials are based on the most recent Mortgage that was taken out on this home.
Original Mortgage
$160,000
Interest Rate
3.93%
Mortgage Type
New Conventional
Purchase Details
Closed on
Jul 27, 1999
Sold by
Johnson Adele L
Bought by
Hoffman Robert E and Hoffman Joan F
Create a Home Valuation Report for This Property
The Home Valuation Report is an in-depth analysis detailing your home's value as well as a comparison with similar homes in the area
Home Values in the Area
Average Home Value in this Area
Purchase History
| Date | Buyer | Sale Price | Title Company |
|---|---|---|---|
| Nelson Dominic | $405,000 | Titlesmart Inc | |
| Hoplin Sarah | -- | Ancona Title & Escrow | |
| David G Hoplin Trust | $229,900 | Title Specialists Inc | |
| Hoffman Robert E | $165,000 | -- |
Source: Public Records
Mortgage History
| Date | Status | Borrower | Loan Amount |
|---|---|---|---|
| Open | Nelson Dominic | $324,000 | |
| Previous Owner | David G Hoplin Trust | $160,000 |
Source: Public Records
Tax History
| Year | Tax Paid | Tax Assessment Tax Assessment Total Assessment is a certain percentage of the fair market value that is determined by local assessors to be the total taxable value of land and additions on the property. | Land | Improvement |
|---|---|---|---|---|
| 2024 | $3,586 | $401,600 | $107,800 | $293,800 |
| 2023 | $3,586 | $385,700 | $105,400 | $280,300 |
| 2022 | $2,644 | $364,600 | $105,100 | $259,500 |
| 2021 | $2,650 | $275,200 | $91,400 | $183,800 |
| 2020 | $2,782 | $272,300 | $87,900 | $184,400 |
| 2019 | $2,670 | $275,000 | $83,100 | $191,900 |
| 2018 | $2,422 | $253,200 | $77,600 | $175,600 |
| 2017 | $2,421 | $240,000 | $74,000 | $166,000 |
| 2016 | $2,973 | $232,700 | $70,400 | $162,300 |
| 2015 | $3,073 | $202,669 | $64,825 | $137,844 |
| 2014 | -- | $201,579 | $61,182 | $140,397 |
| 2013 | -- | $195,584 | $59,060 | $136,524 |
Source: Public Records
Map
Nearby Homes
- 130x Dodd Rd
- 625 Ivy Falls Ave
- 622 Maple Park Dr
- 1320 Riverside Ln Unit 200
- 685 Hidden Creek Trail
- 791 Evergreen Knolls
- 8 Dorset Rd
- 614 Hidden Creek Trail
- 426 Emerson Ave W
- 1248 Delaware Ave
- 396 Thompson Ave W
- 1306 Ottawa Ave
- 679 Marie Ave W
- 631 Callahan Place
- 641 Sibley Memorial Hwy
- TBD Barbara Ct
- 1072 Delaware Ave
- 1871 Chardel Ct
- 708 Linden St
- 69 Langer Cir
Your Personal Tour Guide
Ask me questions while you tour the home.