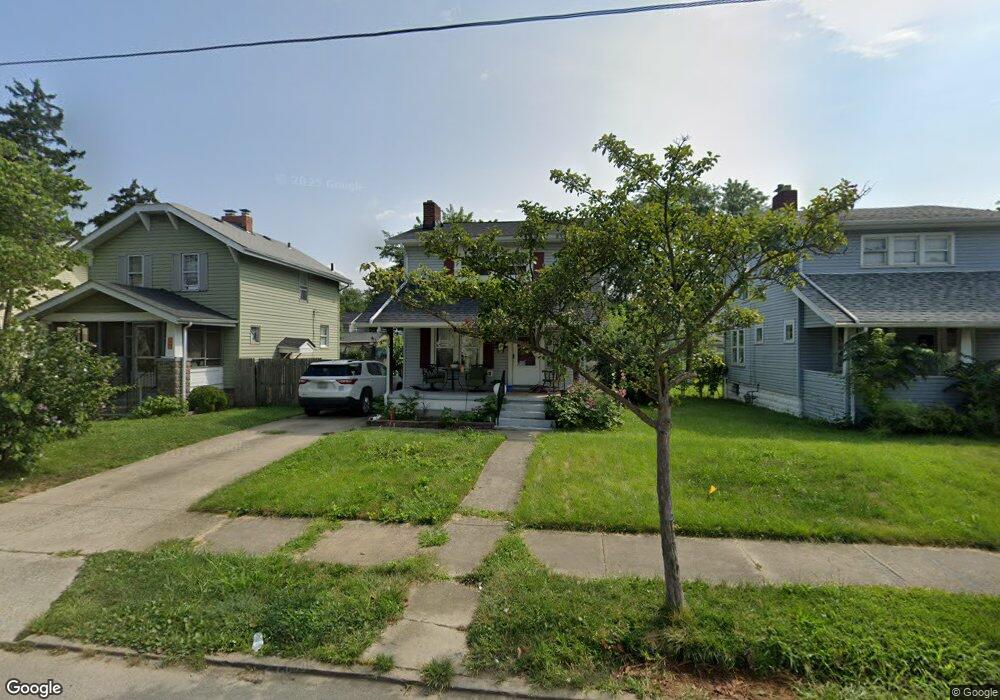
666 S Eureka Ave Columbus, OH 43204
South Central Hilltop NeighborhoodEstimated Value: $117,000 - $132,252
2
Beds
2
Baths
1,104
Sq Ft
$114/Sq Ft
Est. Value
About This Home
This home is located at 666 S Eureka Ave, Columbus, OH 43204 and is currently estimated at $125,813, approximately $113 per square foot. 666 S Eureka Ave is a home located in Franklin County with nearby schools including Lindbergh Elementary School, Hilltonia Middle School, and Briggs High School.
Ownership History
Date
Name
Owned For
Owner Type
Purchase Details
Closed on
Aug 22, 2023
Sold by
Keen Brittany N
Bought by
Keen Brittany N and Masterson Nathan
Current Estimated Value
Home Financials for this Owner
Home Financials are based on the most recent Mortgage that was taken out on this home.
Original Mortgage
$19,100
Outstanding Balance
$17,065
Interest Rate
6.06%
Mortgage Type
Credit Line Revolving
Estimated Equity
$108,748
Purchase Details
Closed on
Jun 4, 2021
Sold by
Masterson Edward A and Masterson Linda L
Bought by
Keen Brittany N
Home Financials for this Owner
Home Financials are based on the most recent Mortgage that was taken out on this home.
Original Mortgage
$86,487
Interest Rate
2.9%
Mortgage Type
FHA
Purchase Details
Closed on
Mar 26, 2006
Sold by
Masterson Margaret A
Bought by
Masterson Edward A and Masterson Linda L
Purchase Details
Closed on
Sep 30, 1997
Sold by
Masterson Philip M
Bought by
Masterson Lester L and Masterson Margaret A
Purchase Details
Closed on
Sep 24, 1992
Create a Home Valuation Report for This Property
The Home Valuation Report is an in-depth analysis detailing your home's value as well as a comparison with similar homes in the area
Home Values in the Area
Average Home Value in this Area
Purchase History
| Date | Buyer | Sale Price | Title Company |
|---|---|---|---|
| Keen Brittany N | -- | Elite Land Title | |
| Keen Brittany N | $105,000 | Midland Title West | |
| Masterson Edward A | -- | Attorney | |
| Masterson Lester L | -- | -- | |
| -- | $51,000 | -- |
Source: Public Records
Mortgage History
| Date | Status | Borrower | Loan Amount |
|---|---|---|---|
| Open | Keen Brittany N | $19,100 | |
| Previous Owner | Keen Brittany N | $86,487 |
Source: Public Records
Tax History
| Year | Tax Paid | Tax Assessment Tax Assessment Total Assessment is a certain percentage of the fair market value that is determined by local assessors to be the total taxable value of land and additions on the property. | Land | Improvement |
|---|---|---|---|---|
| 2025 | $1,737 | $38,710 | $4,830 | $33,880 |
| 2024 | $1,737 | $38,710 | $4,830 | $33,880 |
| 2023 | $1,715 | $38,710 | $4,830 | $33,880 |
| 2022 | $1,022 | $19,710 | $1,960 | $17,750 |
| 2021 | $1,049 | $19,710 | $1,960 | $17,750 |
| 2020 | $1,201 | $19,710 | $1,960 | $17,750 |
| 2019 | $1,203 | $15,960 | $1,610 | $14,350 |
| 2018 | $1,133 | $15,960 | $1,610 | $14,350 |
| 2017 | $1,042 | $15,960 | $1,610 | $14,350 |
| 2016 | $1,236 | $18,200 | $4,340 | $13,860 |
| 2015 | $1,126 | $18,200 | $4,340 | $13,860 |
| 2014 | $1,128 | $18,200 | $4,340 | $13,860 |
| 2013 | $655 | $21,420 | $5,110 | $16,310 |
Source: Public Records
Map
Nearby Homes
- 667 S Oakley Ave
- 651 S Terrace Ave
- 637 S Wheatland Ave Unit 639
- 558 S Oakley Ave Unit 60
- 734 S Richardson Ave
- 542 S Oakley Ave
- 727 S Richardson Ave
- 815 S Wayne Ave
- 511 S Wayne Ave
- 538 S Wheatland Ave
- 2397 Sullivant Ave
- 545-547 S Highland Ave Unit 545
- 2541 Sullivant Ave Unit 543
- 2247 Safford Ave
- 599 S Burgess Ave Unit 601
- 622 S Ogden Ave Unit 624
- 461 S Terrace Ave
- 460 S Richardson Ave
- 426 S Eureka Ave
- 2579 Eakin Rd
- 660 S Eureka Ave
- 672 S Eureka Ave
- 656 S Eureka Ave
- 650 S Eureka Ave
- 684 S Eureka Ave
- 659 S Wayne Ave
- 653 S Wayne Ave
- 663 S Wayne Ave
- 644 S Eureka Ave
- 649 S Wayne Ave
- 688 S Eureka Ave
- 643 S Wayne Ave
- 665 S Eureka Ave
- 675 S Wayne Ave
- 661 S Eureka Ave
- 671 S Eureka Ave
- 694 S Eureka Ave
- 655 S Eureka Ave
- 637 S Wayne Ave
- 681 S Wayne Ave
Your Personal Tour Guide
Ask me questions while you tour the home.