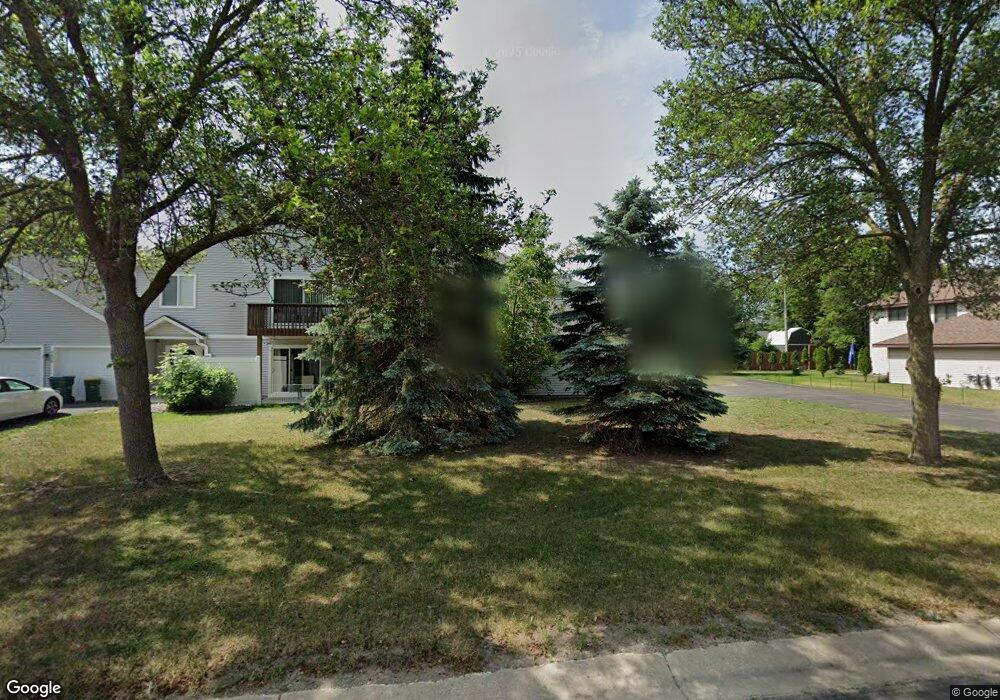
6666 162nd Ct Rosemount, MN 55068
Estimated Value: $179,233 - $191,000
2
Beds
1
Bath
960
Sq Ft
$195/Sq Ft
Est. Value
About This Home
This home is located at 6666 162nd Ct, Rosemount, MN 55068 and is currently estimated at $187,308, approximately $195 per square foot. 6666 162nd Ct is a home located in Dakota County with nearby schools including Parkview Elementary School, Scott Highlands Middle School, and Rosemount Senior High School.
Ownership History
Date
Name
Owned For
Owner Type
Purchase Details
Closed on
Sep 21, 2021
Sold by
Mahlstedt Melissa Ann
Bought by
Putrah Tyler and Putrah Alessandra
Current Estimated Value
Home Financials for this Owner
Home Financials are based on the most recent Mortgage that was taken out on this home.
Original Mortgage
$123,000
Outstanding Balance
$111,921
Interest Rate
2.8%
Mortgage Type
New Conventional
Estimated Equity
$75,387
Purchase Details
Closed on
Dec 8, 2017
Sold by
Hall Jaime L and Hall Steve
Bought by
Mahlstedt Melissa Ann
Home Financials for this Owner
Home Financials are based on the most recent Mortgage that was taken out on this home.
Original Mortgage
$105,545
Interest Rate
3.94%
Mortgage Type
New Conventional
Purchase Details
Closed on
Feb 25, 2000
Sold by
Rose Cecilia and Rose Chad
Bought by
Clingingsmith Robert R
Purchase Details
Closed on
Dec 2, 1997
Sold by
Anderson Jay R
Bought by
Remund Cecilia E
Create a Home Valuation Report for This Property
The Home Valuation Report is an in-depth analysis detailing your home's value as well as a comparison with similar homes in the area
Home Values in the Area
Average Home Value in this Area
Purchase History
| Date | Buyer | Sale Price | Title Company |
|---|---|---|---|
| Putrah Tyler | $153,751 | Dca Title | |
| Mahlstedt Melissa Ann | $111,100 | Home Title Inc | |
| Clingingsmith Robert R | $80,000 | -- | |
| Remund Cecilia E | $63,000 | -- |
Source: Public Records
Mortgage History
| Date | Status | Borrower | Loan Amount |
|---|---|---|---|
| Open | Putrah Tyler | $123,000 | |
| Previous Owner | Mahlstedt Melissa Ann | $105,545 |
Source: Public Records
Tax History Compared to Growth
Tax History
| Year | Tax Paid | Tax Assessment Tax Assessment Total Assessment is a certain percentage of the fair market value that is determined by local assessors to be the total taxable value of land and additions on the property. | Land | Improvement |
|---|---|---|---|---|
| 2024 | $1,698 | $165,400 | $15,200 | $150,200 |
| 2023 | $1,698 | $160,900 | $14,600 | $146,300 |
| 2022 | $1,334 | $155,700 | $14,100 | $141,600 |
| 2021 | $1,244 | $139,500 | $13,900 | $125,600 |
| 2020 | $1,166 | $127,800 | $12,700 | $115,100 |
| 2019 | $924 | $118,400 | $11,800 | $106,600 |
| 2018 | $918 | $103,900 | $10,400 | $93,500 |
| 2017 | $735 | $101,200 | $10,100 | $91,100 |
| 2016 | $560 | $81,000 | $8,100 | $72,900 |
| 2015 | $538 | $36,960 | $3,660 | $33,300 |
| 2014 | -- | $35,880 | $3,600 | $32,280 |
| 2013 | -- | $34,680 | $3,480 | $31,200 |
Source: Public Records
Map
Nearby Homes
- 6634 162nd Ct Unit 421
- 6656 Gerdine Path W
- 6744 Foliage Ct W
- 6852 161st St W
- 16546 Foliage Ave W
- 6678 166th St W
- 16563 Fishing Ave W
- 6649 167th St W
- 6760 158th St W
- 6414 158th St W Unit 201
- 15792 Flan Ct
- 7125 Upper 163rd St W
- 15854 Frisian Ln
- 15823 Freedom Ln
- 15822 Frisian Ln
- 15725 France Way Unit 1416
- 6406 157th St W
- 6869 Folkestone Rd Unit 614
- 6456 157th St W
- 16660 Garland Way W
- 6666 162nd Ct Unit 523
- 6662 162nd Ct Unit 511
- 6662 162nd Ct
- 6642 6642 162nd Ct
- 6658 162nd Ct Unit 521
- 6654 162nd Ct
- 6650 6650 162nd Ct
- 6650 162nd Ct
- 6654 6654 162nd Ct
- 6646 162nd Ct
- 6670 162nd Ct
- 6642 162nd Ct
- 6674 162nd Ct Unit 612
- 6674 162nd Ct
- 6638 162nd Ct
- 6638 162nd Ct
- 6678 162nd Ct
- 6678 6678 162nd Ct
- 16272 Florida Way W
- 6674 6674 162nd Ct