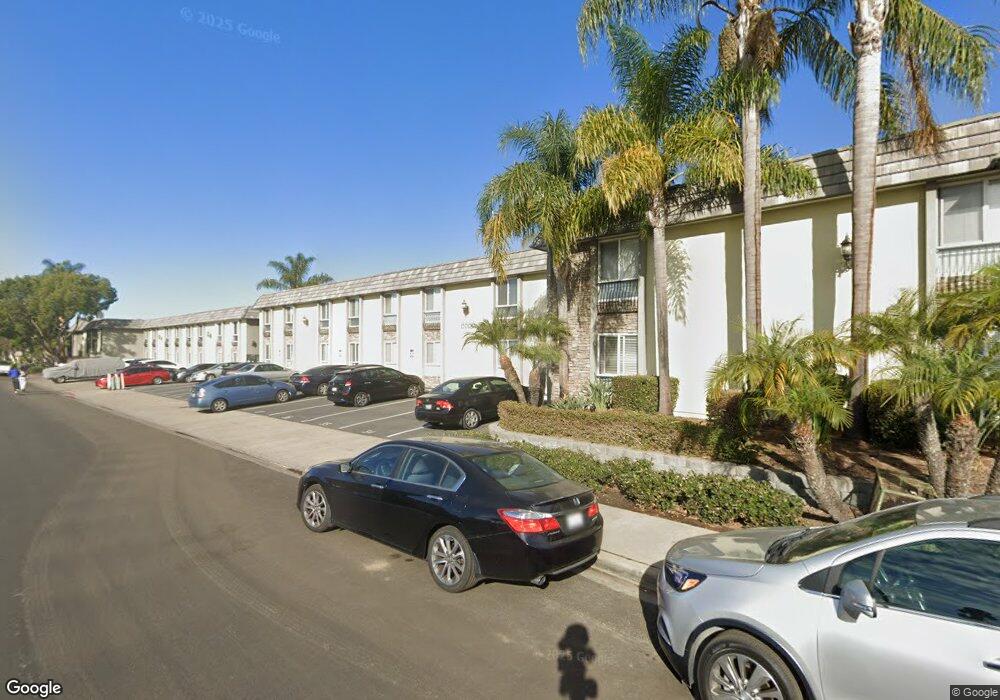
6666 Beadnell Way Unit 25 San Diego, CA 92117
Clairemont Mesa East NeighborhoodEstimated Value: $512,000 - $528,688
2
Beds
2
Baths
923
Sq Ft
$565/Sq Ft
Est. Value
About This Home
This home is located at 6666 Beadnell Way Unit 25, San Diego, CA 92117 and is currently estimated at $521,422, approximately $564 per square foot. 6666 Beadnell Way Unit 25 is a home located in San Diego County with nearby schools including Lafayette Elementary, Innovation Middle School, and Madison High School.
Ownership History
Date
Name
Owned For
Owner Type
Purchase Details
Closed on
Sep 23, 2016
Sold by
Cai Syminton and Jung Lena
Bought by
Cai Syminton
Current Estimated Value
Purchase Details
Closed on
Jan 3, 2011
Sold by
Battah Sinan E and Battah Monica J
Bought by
Cai Syminton and Jung Lena
Home Financials for this Owner
Home Financials are based on the most recent Mortgage that was taken out on this home.
Original Mortgage
$110,000
Outstanding Balance
$3,260
Interest Rate
4.15%
Mortgage Type
New Conventional
Estimated Equity
$518,162
Purchase Details
Closed on
Apr 18, 2005
Sold by
6602 Beadnell Coastal Llc
Bought by
Battah Sinan E and Battah Monica J
Home Financials for this Owner
Home Financials are based on the most recent Mortgage that was taken out on this home.
Original Mortgage
$264,400
Interest Rate
6.5%
Mortgage Type
Purchase Money Mortgage
Create a Home Valuation Report for This Property
The Home Valuation Report is an in-depth analysis detailing your home's value as well as a comparison with similar homes in the area
Home Values in the Area
Average Home Value in this Area
Purchase History
| Date | Buyer | Sale Price | Title Company |
|---|---|---|---|
| Cai Syminton | -- | None Available | |
| Cai Syminton | $160,000 | Fidelity National Title | |
| Battah Sinan E | $330,500 | Chicago Title Co |
Source: Public Records
Mortgage History
| Date | Status | Borrower | Loan Amount |
|---|---|---|---|
| Open | Cai Syminton | $110,000 | |
| Previous Owner | Battah Sinan E | $264,400 | |
| Closed | Battah Sinan E | $66,100 |
Source: Public Records
Tax History Compared to Growth
Tax History
| Year | Tax Paid | Tax Assessment Tax Assessment Total Assessment is a certain percentage of the fair market value that is determined by local assessors to be the total taxable value of land and additions on the property. | Land | Improvement |
|---|---|---|---|---|
| 2025 | $2,500 | $204,976 | $137,079 | $67,897 |
| 2024 | $2,500 | $200,958 | $134,392 | $66,566 |
| 2023 | $2,445 | $197,018 | $131,757 | $65,261 |
| 2022 | $2,380 | $193,156 | $129,174 | $63,982 |
| 2021 | $2,364 | $189,370 | $126,642 | $62,728 |
| 2020 | $2,335 | $187,429 | $125,344 | $62,085 |
| 2019 | $2,294 | $183,755 | $122,887 | $60,868 |
| 2018 | $2,146 | $180,153 | $120,478 | $59,675 |
| 2017 | $81 | $176,621 | $118,116 | $58,505 |
| 2016 | $2,061 | $173,158 | $115,800 | $57,358 |
| 2015 | $2,031 | $170,558 | $114,061 | $56,497 |
| 2014 | $2,000 | $167,218 | $111,827 | $55,391 |
Source: Public Records
Map
Nearby Homes
- 6666 Beadnell Way Unit 9
- 6666 Beadnell Way Unit 15
- 6602 Beadnell Way Unit 13
- 4261 Cannington Dr
- 6750 Beadnell Way Unit 3
- 4410 Charger Blvd
- 6333 Mount Ada Rd Unit 278
- 6333 Mount Ada Rd Unit 258
- 6333 Mount Ada Rd Unit 156
- 6535 Mount Albertine Ct
- 6939 Bettyhill Dr
- 5783 Camber Dr
- 5768 Camber Dr
- 5715 Castleton Dr
- 4018 Hatton St
- 5656 Chandler Dr
- 7003 E Batista St
- 3906 Mount Ainsworth Ave
- 5402 Balboa Arms Dr Unit 345
- 4119 Mount Alifan Place
- 6666 Beadnell Way
- 6602 Beadnell Way
- 6666 Beadnell Way Unit 2
- 6666 Beadnell Way Unit 3
- 6666 Beadnell Way Unit 4
- 6666 Beadnell Way Unit 19
- 6666 Beadnell Way Unit 20
- 6666 Beadnell Way Unit 21
- 6666 Beadnell Way Unit 22
- 6666 Beadnell Way Unit 23
- 6666 Beadnell Way Unit 5
- 6666 Beadnell Way Unit 6
- 6666 Beadnell Way Unit 7
- 6666 Beadnell Way Unit 8
- 6666 Beadnell Way Unit 24
- 6666 Beadnell Way Unit 26
- 6666 Beadnell Way Unit 28
- 6666 Beadnell Way Unit 10
- 6666 Beadnell Way Unit 11
- 6666 Beadnell Way Unit 12