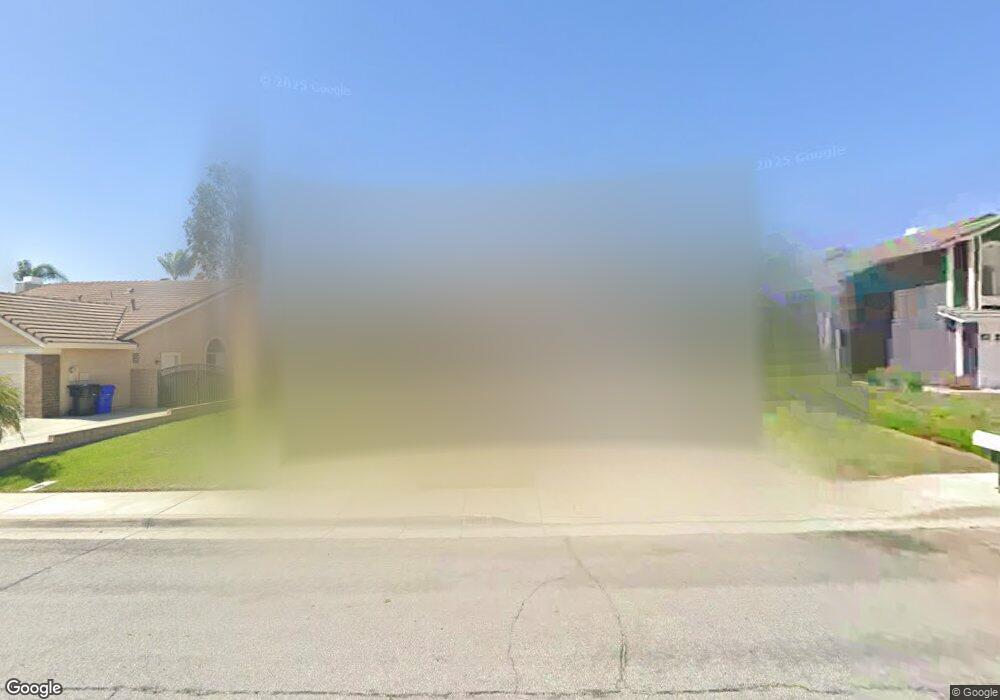
6668 Vanderbilt Place Rancho Cucamonga, CA 91701
Victoria NeighborhoodEstimated Value: $881,784 - $980,000
4
Beds
3
Baths
2,141
Sq Ft
$431/Sq Ft
Est. Value
About This Home
This home is located at 6668 Vanderbilt Place, Rancho Cucamonga, CA 91701 and is currently estimated at $922,946, approximately $431 per square foot. 6668 Vanderbilt Place is a home located in San Bernardino County with nearby schools including Victoria Groves Elementary, Vineyard Junior High, and Los Osos High.
Ownership History
Date
Name
Owned For
Owner Type
Purchase Details
Closed on
Nov 3, 2011
Current Estimated Value
Home Financials for this Owner
Home Financials are based on the most recent Mortgage that was taken out on this home.
Original Mortgage
$221,700
Outstanding Balance
$87,723
Interest Rate
3.95%
Mortgage Type
New Conventional
Estimated Equity
$835,223
Purchase Details
Closed on
Nov 5, 2003
Purchase Details
Closed on
Jul 2, 2003
Home Financials for this Owner
Home Financials are based on the most recent Mortgage that was taken out on this home.
Original Mortgage
$186,300
Interest Rate
5.18%
Mortgage Type
Purchase Money Mortgage
Purchase Details
Closed on
Apr 7, 2003
Purchase Details
Closed on
May 15, 2001
Sold by
Nealis Thomas M and Nealis Karen L
Home Financials for this Owner
Home Financials are based on the most recent Mortgage that was taken out on this home.
Original Mortgage
$165,000
Interest Rate
7.15%
Purchase Details
Closed on
Nov 2, 1999
Sold by
Mcallister Wilfred J and Mc Allister Valery J
Bought by
Neales Thomas M and Neals Karen L
Home Financials for this Owner
Home Financials are based on the most recent Mortgage that was taken out on this home.
Original Mortgage
$132,000
Interest Rate
7.87%
Create a Home Valuation Report for This Property
The Home Valuation Report is an in-depth analysis detailing your home's value as well as a comparison with similar homes in the area
Home Values in the Area
Average Home Value in this Area
Purchase History
| Date | Buyer | Sale Price | Title Company |
|---|---|---|---|
| -- | -- | Chicago Title Inland Empire | |
| -- | -- | Chicago Title Inland Empire | |
| -- | -- | -- | |
| -- | -- | Chicago Title Co | |
| -- | -- | -- | |
| -- | $255,000 | Fidelity National Title Ins | |
| Neales Thomas M | $232,000 | Fidelity National Title |
Source: Public Records
Mortgage History
| Date | Status | Borrower | Loan Amount |
|---|---|---|---|
| Open | -- | $221,700 | |
| Closed | -- | $186,300 | |
| Closed | -- | $165,000 | |
| Previous Owner | Neales Thomas M | $132,000 |
Source: Public Records
Tax History Compared to Growth
Tax History
| Year | Tax Paid | Tax Assessment Tax Assessment Total Assessment is a certain percentage of the fair market value that is determined by local assessors to be the total taxable value of land and additions on the property. | Land | Improvement |
|---|---|---|---|---|
| 2025 | $4,870 | $384,252 | $96,063 | $288,189 |
| 2024 | $4,870 | $376,717 | $94,179 | $282,538 |
| 2023 | $4,738 | $369,330 | $92,332 | $276,998 |
| 2022 | $4,691 | $362,089 | $90,522 | $271,567 |
| 2021 | $4,673 | $354,989 | $88,747 | $266,242 |
| 2020 | $4,508 | $351,349 | $87,837 | $263,512 |
| 2019 | $4,550 | $344,460 | $86,115 | $258,345 |
| 2018 | $4,462 | $337,705 | $84,426 | $253,279 |
| 2017 | $4,274 | $331,084 | $82,771 | $248,313 |
| 2016 | $4,162 | $324,592 | $81,148 | $243,444 |
| 2015 | $4,205 | $319,716 | $79,929 | $239,787 |
| 2014 | $4,109 | $313,453 | $78,363 | $235,090 |
Source: Public Records
Map
Nearby Homes
- 6792 Galveston Place
- 11344 Sunrise Ct
- 11376 Starlight Dr
- 6886 Cabrini Ct
- 11253 Drake St
- 10980 Santa Barbara Place
- 11266 Gannon St
- 6572 San Benito Ave
- 6979 Walker Ct
- 11017 Piedmont St
- 11530 Marcello Way
- 6915 Stanislaus Place
- 6393 Kettle Peak Place
- 11571 Pinnacle Peak Ct
- 10815 Plumas Rd
- 6516 Alameda Ave
- 6701 Marsala Place
- 11537 Mount Hood Ct
- 6999 Canosa Place
- 10672 Finch Ave
- 6678 Vanderbilt Place
- 6658 Vanderbilt Place
- 6688 Vanderbilt Place
- 6648 Vanderbilt Place
- 11164 Pacific St
- 11241 Clemson Dr
- 6698 Vanderbilt Place
- 11165 Pacific St
- 11244 Bethany Dr
- 11158 Pacific St
- 11159 Pacific St
- 11247 Clemson Dr
- 11152 Pacific St
- 11234 Clemson Dr
- 6708 Vanderbilt Place
- 11250 Bethany Dr
- 6638 Vanderbilt Place
- 11153 Pacific St
- 11240 Clemson Dr
- 11146 Pacific St