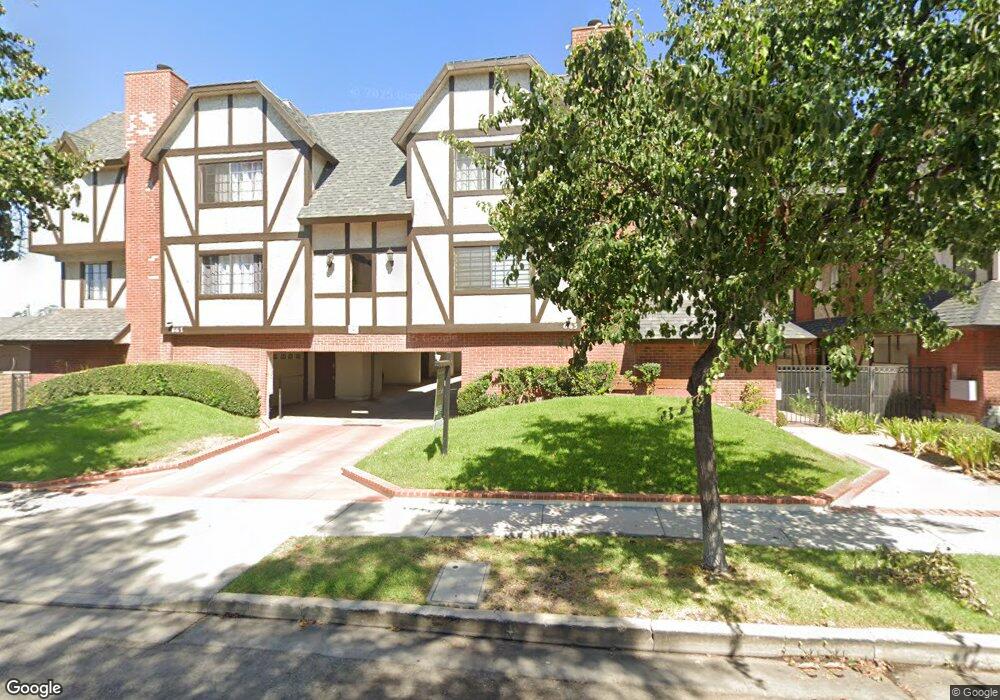
667 Alexander St Unit 7 Glendale, CA 91203
Vineyard NeighborhoodEstimated Value: $716,534 - $819,000
3
Beds
3
Baths
1,329
Sq Ft
$585/Sq Ft
Est. Value
About This Home
This home is located at 667 Alexander St Unit 7, Glendale, CA 91203 and is currently estimated at $776,884, approximately $584 per square foot. 667 Alexander St Unit 7 is a home located in Los Angeles County with nearby schools including Columbus Elementary School, Eleanor J. Toll Middle School, and Herbert Hoover High School.
Ownership History
Date
Name
Owned For
Owner Type
Purchase Details
Closed on
Apr 29, 2010
Sold by
Badalian Zara
Bought by
Alikhanian Areg and Badalian Zara
Current Estimated Value
Purchase Details
Closed on
Apr 3, 2002
Sold by
Alikhanian Areg K
Bought by
Badalian Zara
Home Financials for this Owner
Home Financials are based on the most recent Mortgage that was taken out on this home.
Original Mortgage
$180,000
Outstanding Balance
$80,858
Interest Rate
7.99%
Estimated Equity
$696,026
Purchase Details
Closed on
Feb 1, 1999
Sold by
Imelda De Leon Vicente S and Imelda De Leon Rivera De Le
Bought by
Alikhanian Areg K and Badalian Zara
Home Financials for this Owner
Home Financials are based on the most recent Mortgage that was taken out on this home.
Original Mortgage
$144,000
Interest Rate
6.76%
Create a Home Valuation Report for This Property
The Home Valuation Report is an in-depth analysis detailing your home's value as well as a comparison with similar homes in the area
Home Values in the Area
Average Home Value in this Area
Purchase History
| Date | Buyer | Sale Price | Title Company |
|---|---|---|---|
| Alikhanian Areg | -- | None Available | |
| Badalian Zara | -- | Commerce Title | |
| Alikhanian Areg K | $160,000 | American Title Co |
Source: Public Records
Mortgage History
| Date | Status | Borrower | Loan Amount |
|---|---|---|---|
| Open | Badalian Zara | $180,000 | |
| Closed | Alikhanian Areg K | $144,000 | |
| Closed | Badalian Zara | $45,000 |
Source: Public Records
Tax History
| Year | Tax Paid | Tax Assessment Tax Assessment Total Assessment is a certain percentage of the fair market value that is determined by local assessors to be the total taxable value of land and additions on the property. | Land | Improvement |
|---|---|---|---|---|
| 2025 | $2,829 | $250,810 | $107,377 | $143,433 |
| 2024 | $2,829 | $245,893 | $105,272 | $140,621 |
| 2023 | $2,767 | $241,072 | $103,208 | $137,864 |
| 2022 | $2,717 | $236,346 | $101,185 | $135,161 |
| 2021 | $2,665 | $231,712 | $99,201 | $132,511 |
| 2019 | $2,564 | $224,841 | $96,259 | $128,582 |
| 2018 | $2,514 | $220,433 | $94,372 | $126,061 |
| 2016 | $2,387 | $211,875 | $90,708 | $121,167 |
| 2015 | $2,339 | $208,693 | $89,346 | $119,347 |
| 2014 | $2,325 | $204,606 | $87,596 | $117,010 |
Source: Public Records
Map
Nearby Homes
- 345 Concord St
- 343 Concord St
- 516 W Lexington Dr
- 520 W California Ave
- 656 W Glenoaks Blvd
- 612 N Columbus Ave Unit 104
- 408 Burchett St Unit 5
- 464 W Wilson Ave
- 412 Burchett St Unit 17
- 409 Burchett St Unit 220
- 419 Salem St
- 345 Pioneer Dr Unit 902
- 732 W Dryden St
- 430 W Wilson Ave Unit 116
- 333 Milford St Unit 105
- 350 Burchett St Unit 101
- 450 W Dryden St Unit 303
- 365 Burchett St Unit 118
- 365 Burchett St Unit 217
- 533 Hawthorne St
- 667 Alexander St Unit 5
- 667 Alexander St Unit 8
- 667 Alexander St Unit 6
- 663 Alexander St
- 663 Alexander St Unit 1
- 663 Alexander St Unit 4
- 663 Alexander St Unit 3
- 663 Alexander St Unit 2
- 671 Alexander St
- 655 Alexander St Unit 5
- 655 Alexander St Unit 4
- 655 Alexander St Unit 3
- 655 Alexander St Unit 2
- 655 Alexander St Unit 1
- 659 Alexander St Unit 8
- 659 Alexander St Unit 7
- 659 Alexander St Unit 6
- 659 Alexander St Unit 5
- 662 W Doran St
- 666 W Doran St
Your Personal Tour Guide
Ask me questions while you tour the home.