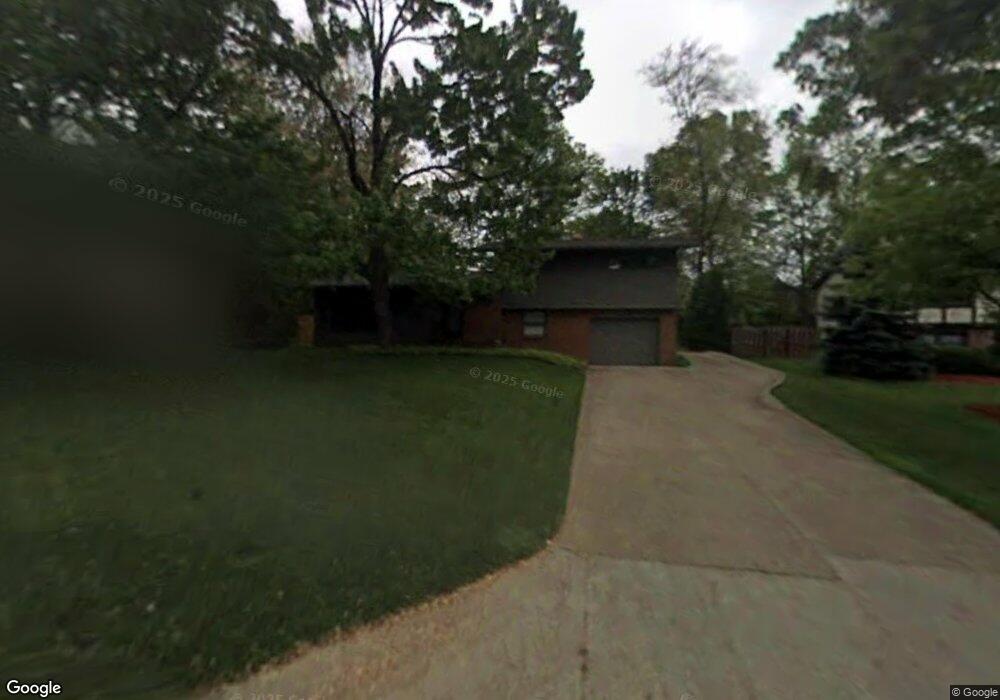
667 Hampshire Rd Fairlawn, OH 44333
Estimated Value: $265,000 - $298,000
4
Beds
3
Baths
1,373
Sq Ft
$208/Sq Ft
Est. Value
About This Home
This home is located at 667 Hampshire Rd, Fairlawn, OH 44333 and is currently estimated at $286,252, approximately $208 per square foot. 667 Hampshire Rd is a home located in Summit County with nearby schools including Copley-Fairlawn Middle School, Copley High School, and Fairlawn Lutheran School.
Ownership History
Date
Name
Owned For
Owner Type
Purchase Details
Closed on
Nov 22, 2004
Sold by
Oneill Rebecca J
Bought by
Sheldon Jeremy D and Sheldon Kristin N
Current Estimated Value
Home Financials for this Owner
Home Financials are based on the most recent Mortgage that was taken out on this home.
Original Mortgage
$127,500
Outstanding Balance
$63,796
Interest Rate
5.82%
Mortgage Type
Purchase Money Mortgage
Estimated Equity
$222,456
Purchase Details
Closed on
May 25, 2004
Sold by
Oneill Gilbert F and Oneill Rebecca J
Bought by
Oneill Gilbert F and Oneill Rebecca J
Purchase Details
Closed on
Mar 2, 1999
Sold by
Dufore Timothy R
Bought by
Oneill Gilbert F and Oneill Rebecca J
Home Financials for this Owner
Home Financials are based on the most recent Mortgage that was taken out on this home.
Original Mortgage
$117,700
Interest Rate
6.83%
Mortgage Type
Purchase Money Mortgage
Create a Home Valuation Report for This Property
The Home Valuation Report is an in-depth analysis detailing your home's value as well as a comparison with similar homes in the area
Home Values in the Area
Average Home Value in this Area
Purchase History
| Date | Buyer | Sale Price | Title Company |
|---|---|---|---|
| Sheldon Jeremy D | $157,500 | Statewide Title | |
| Oneill Gilbert F | -- | -- | |
| Oneill Gilbert F | $132,000 | -- |
Source: Public Records
Mortgage History
| Date | Status | Borrower | Loan Amount |
|---|---|---|---|
| Open | Sheldon Jeremy D | $127,500 | |
| Previous Owner | Oneill Gilbert F | $117,700 |
Source: Public Records
Tax History Compared to Growth
Tax History
| Year | Tax Paid | Tax Assessment Tax Assessment Total Assessment is a certain percentage of the fair market value that is determined by local assessors to be the total taxable value of land and additions on the property. | Land | Improvement |
|---|---|---|---|---|
| 2025 | $2,806 | $70,582 | $17,945 | $52,637 |
| 2024 | $2,806 | $70,582 | $17,945 | $52,637 |
| 2023 | $2,806 | $70,582 | $17,945 | $52,637 |
| 2022 | $2,804 | $58,384 | $14,707 | $43,677 |
| 2021 | $2,634 | $58,384 | $14,707 | $43,677 |
| 2020 | $2,575 | $58,390 | $14,710 | $43,680 |
| 2019 | $2,571 | $52,190 | $12,930 | $39,260 |
| 2018 | $2,519 | $52,190 | $12,930 | $39,260 |
| 2017 | $2,688 | $52,190 | $12,930 | $39,260 |
| 2016 | $2,686 | $52,190 | $12,930 | $39,260 |
| 2015 | $2,688 | $52,190 | $12,930 | $39,260 |
| 2014 | $2,678 | $52,190 | $12,930 | $39,260 |
| 2013 | $2,689 | $52,540 | $12,930 | $39,610 |
Source: Public Records
Map
Nearby Homes
- 595 Moorfield Rd
- 2385 Covington Rd Unit 402
- 2375 Covington Rd Unit 311
- 288 Kenridge Rd
- 2445 Chatham Rd
- 177 Caladonia Ave
- 2520 Holgate Rd
- 342 S Miller Rd
- 2595 Sand Run Pkwy
- 320 Caladonia Ave
- 135 Southwood Rd
- 441 Sandhurst Rd
- 3081 Bancroft Rd
- 48 S Wheaton Rd
- 2239 Woodpark Rd
- 3143 Morewood Rd
- 128 Overwood Rd
- 47 S Wheaton Rd
- V/L White Tail Ridge Dr
- 3317 Morewood Rd
- 673 Hampshire Rd
- 655 Hampshire Rd
- 679 Hampshire Rd
- 670 Hampshire Rd
- 664 Hampshire Rd
- V/L Hampshire Rd
- 693 V/L Hampshire Rd
- 684 Hampshire Rd
- 691 Hampshire Rd Unit 693
- 633 Hampshire Rd
- 640 Hampshire Rd
- 668 Moorfield Rd
- 693 Hampshire Rd
- 658 Moorfield Rd
- 646 Moorfield Rd
- 2581 Chamberlain Rd
- 2581 Chamberlain Rd
- 639 Moorfield Rd
- 630 Hampshire Rd
- 627 Hampshire Rd