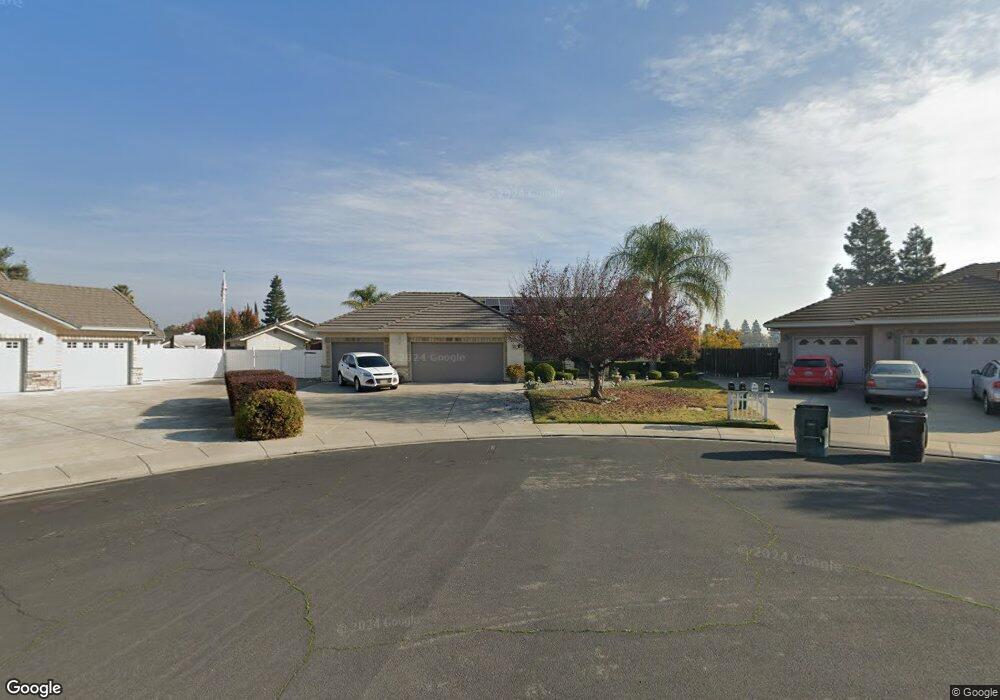
667 Hawes St Manteca, CA 95336
Downtown Manteca NeighborhoodEstimated Value: $475,000 - $660,410
4
Beds
2
Baths
2,130
Sq Ft
$281/Sq Ft
Est. Value
About This Home
This home is located at 667 Hawes St, Manteca, CA 95336 and is currently estimated at $599,353, approximately $281 per square foot. 667 Hawes St is a home located in San Joaquin County with nearby schools including Shasta Elementary School, Manteca High School, and St. Anthony's Catholic School.
Ownership History
Date
Name
Owned For
Owner Type
Purchase Details
Closed on
Aug 21, 2007
Sold by
Wong Chris W and Wong Virginia S
Bought by
Wong Chris W and Wong Virginia S
Current Estimated Value
Purchase Details
Closed on
Feb 7, 2003
Sold by
Morse Estates Llc
Bought by
Wong Chris W and Wong Virginia S
Home Financials for this Owner
Home Financials are based on the most recent Mortgage that was taken out on this home.
Original Mortgage
$220,455
Outstanding Balance
$93,106
Interest Rate
5.76%
Estimated Equity
$506,247
Create a Home Valuation Report for This Property
The Home Valuation Report is an in-depth analysis detailing your home's value as well as a comparison with similar homes in the area
Home Values in the Area
Average Home Value in this Area
Purchase History
| Date | Buyer | Sale Price | Title Company |
|---|---|---|---|
| Wong Chris W | -- | None Available | |
| Wong Chris W | $319,500 | Old Republic Title Co |
Source: Public Records
Mortgage History
| Date | Status | Borrower | Loan Amount |
|---|---|---|---|
| Open | Wong Chris W | $220,455 |
Source: Public Records
Tax History
| Year | Tax Paid | Tax Assessment Tax Assessment Total Assessment is a certain percentage of the fair market value that is determined by local assessors to be the total taxable value of land and additions on the property. | Land | Improvement |
|---|---|---|---|---|
| 2025 | $6,162 | $560,182 | $137,580 | $422,602 |
| 2024 | $5,988 | $549,199 | $134,883 | $414,316 |
| 2023 | $5,914 | $538,432 | $132,239 | $406,193 |
| 2022 | $5,824 | $527,876 | $129,647 | $398,229 |
| 2021 | $5,760 | $517,526 | $127,105 | $390,421 |
| 2020 | $5,525 | $512,220 | $125,802 | $386,418 |
| 2019 | $5,452 | $502,178 | $123,336 | $378,842 |
| 2018 | $5,378 | $492,332 | $120,918 | $371,414 |
| 2017 | $5,298 | $482,680 | $118,548 | $364,132 |
| 2016 | $4,527 | $415,000 | $145,000 | $270,000 |
| 2014 | $3,537 | $338,000 | $101,400 | $236,600 |
Source: Public Records
Map
Nearby Homes
- 736 E Louise Ave
- 396 Lancaster Dr
- 1267 Laurel Dr
- 535 Fir St
- 1152 Laureto St
- 757-847 N Main St
- 1231 Marceline Dr
- 1255 Sweetbrier Place
- 1275 Sweetbrier Place
- 701 Victoria Dr
- 1039 Kestrel St
- 311 Charles Ave
- 1253 E Louise Ave
- 1342 Marceline Dr
- 449 Poplar Ave
- 1042 Briar Ct
- 1049 Briar Ct
- 324 Eva Ct
- 119 N Sherman Ave
- 1371 Crescent Ave
Your Personal Tour Guide
Ask me questions while you tour the home.