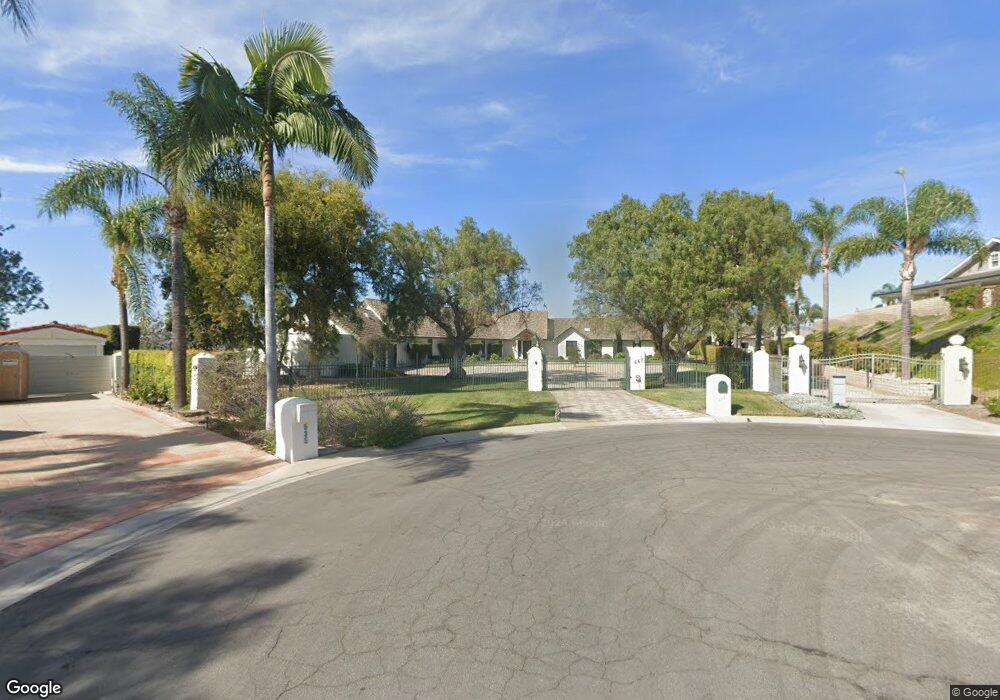
667 Via Con Dios Camarillo, CA 93010
Estimated Value: $2,207,000 - $2,709,000
3
Beds
3
Baths
4,553
Sq Ft
$524/Sq Ft
Est. Value
About This Home
This home is located at 667 Via Con Dios, Camarillo, CA 93010 and is currently estimated at $2,385,895, approximately $524 per square foot. 667 Via Con Dios is a home located in Ventura County with nearby schools including Las Posas Elementary School, Monte Vista Middle School, and Adolfo Camarillo High School.
Ownership History
Date
Name
Owned For
Owner Type
Purchase Details
Closed on
May 14, 2019
Sold by
Taylor Free
Bought by
Taylor Free
Current Estimated Value
Purchase Details
Closed on
Aug 15, 2017
Sold by
England Theodore J and Lacher Stephen
Bought by
Taylor Free
Purchase Details
Closed on
May 15, 2009
Sold by
Taylor A Stanley
Bought by
Taylor A Stanley and Taylor Cameron Ann
Purchase Details
Closed on
Feb 6, 1995
Sold by
Taylor Arthur Stanley
Bought by
Taylor Arthur Stanley
Purchase Details
Closed on
Apr 20, 1994
Sold by
Armstrong Robert Horrall and Armstrong Caroline Ann
Bought by
Taylor A Stanley
Home Financials for this Owner
Home Financials are based on the most recent Mortgage that was taken out on this home.
Original Mortgage
$538,000
Interest Rate
7.79%
Mortgage Type
Seller Take Back
Create a Home Valuation Report for This Property
The Home Valuation Report is an in-depth analysis detailing your home's value as well as a comparison with similar homes in the area
Home Values in the Area
Average Home Value in this Area
Purchase History
| Date | Buyer | Sale Price | Title Company |
|---|---|---|---|
| Taylor Free | -- | None Available | |
| Taylor Free | -- | None Available | |
| Taylor A Stanley | -- | None Available | |
| Taylor A Stanley | -- | None Available | |
| Taylor Arthur Stanley | -- | -- | |
| Taylor A Stanley | $738,000 | First American Title Ins Co |
Source: Public Records
Mortgage History
| Date | Status | Borrower | Loan Amount |
|---|---|---|---|
| Closed | Taylor A Stanley | $538,000 |
Source: Public Records
Tax History
| Year | Tax Paid | Tax Assessment Tax Assessment Total Assessment is a certain percentage of the fair market value that is determined by local assessors to be the total taxable value of land and additions on the property. | Land | Improvement |
|---|---|---|---|---|
| 2025 | $15,377 | $1,416,352 | $679,869 | $736,483 |
| 2024 | $15,377 | $1,388,581 | $666,538 | $722,043 |
| 2023 | $14,822 | $1,361,354 | $653,468 | $707,886 |
| 2022 | $14,779 | $1,334,661 | $640,655 | $694,006 |
| 2021 | $14,245 | $1,308,492 | $628,093 | $680,399 |
| 2020 | $14,194 | $1,295,076 | $621,653 | $673,423 |
| 2019 | $14,131 | $1,269,683 | $609,464 | $660,219 |
| 2018 | $13,870 | $1,244,788 | $597,514 | $647,274 |
| 2017 | $13,048 | $1,220,382 | $585,799 | $634,583 |
| 2016 | $12,733 | $1,196,454 | $574,313 | $622,141 |
| 2015 | $12,599 | $1,178,484 | $565,687 | $612,797 |
| 2014 | $12,303 | $1,155,402 | $554,607 | $600,795 |
Source: Public Records
Map
Nearby Homes
- 525 Valley Vista Dr
- 34 Vientos Rd
- 665 Trueno Ave
- 1361 Calle Aurora
- 365 Valley Vista Dr
- 821 Trueno Ave
- 154 Cerro Crest Dr
- 3181 Goldenspur Dr
- 953 Trueno Ave
- 1065 Garrido Dr
- 3118 Old Coach Dr
- 862 Camino Concordia
- 25 Encino Ave
- 375 W Highland Dr
- 676 W Highland Dr
- 15 Encino Ave
- 576 Corte Aguacate
- 150 300 W Los Angeles Ave
- 244 W Highland Dr
- 85 Crestview Ave
- 630 Via Con Dios
- 660 Via Con Dios
- 675 Fairway Dr
- 615 Country View Place
- 535 Via Con Dios
- 532 Vista Montana
- 552 Via Con Dios
- 601 Country View Place
- 618 Country View Place
- 554 Vista Montana
- 542 Vista Montana
- 680 Fairway Dr
- 670 Fairway Dr
- 517 Via Con Dios
- 562 Vista Montana
- 1245 Vista Del Cima
- 640 Fairway Dr
- 579 Deseo Ave
- 1263 Vista Del Cima
- 606 Deseo Ave