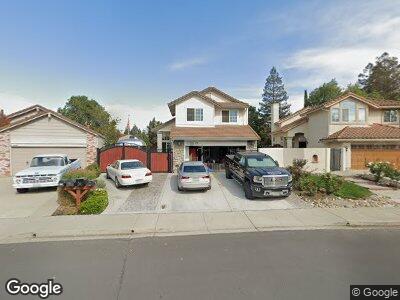
668 Loyola Way Livermore, CA 94550
Windmill Springs NeighborhoodEstimated Value: $1,258,321 - $1,554,000
3
Beds
3
Baths
1,784
Sq Ft
$766/Sq Ft
Est. Value
About This Home
This home is located at 668 Loyola Way, Livermore, CA 94550 and is currently estimated at $1,365,830, approximately $765 per square foot. 668 Loyola Way is a home located in Alameda County with nearby schools including Jackson Avenue Elementary School, East Avenue Middle School, and Livermore High School.
Ownership History
Date
Name
Owned For
Owner Type
Purchase Details
Closed on
Jun 8, 2009
Sold by
Bastovan Nick A and Bastovan Karen S
Bought by
Bastovan Nick A and Bastovan Karen S
Current Estimated Value
Purchase Details
Closed on
Aug 7, 1996
Sold by
Bernardi Giulio and Bernardi Anna
Bought by
Bastovan Nick and Bastovan Karen
Home Financials for this Owner
Home Financials are based on the most recent Mortgage that was taken out on this home.
Original Mortgage
$207,000
Interest Rate
8.18%
Purchase Details
Closed on
May 28, 1996
Sold by
Rundstrom Edwin C and Rundstrom Thelma E
Bought by
Bernardi Giulio and Bernardi Anna M
Create a Home Valuation Report for This Property
The Home Valuation Report is an in-depth analysis detailing your home's value as well as a comparison with similar homes in the area
Home Values in the Area
Average Home Value in this Area
Purchase History
| Date | Buyer | Sale Price | Title Company |
|---|---|---|---|
| Bastovan Nick A | -- | None Available | |
| Bastovan Nick A | -- | None Available | |
| Bastovan Nick | $264,000 | Commonwealth Land Title Co | |
| Bernardi Giulio | $95,000 | Chicago Title Co |
Source: Public Records
Mortgage History
| Date | Status | Borrower | Loan Amount |
|---|---|---|---|
| Open | Bastovan Nick A | $373,200 | |
| Closed | Bastovan Nick | $52,000 | |
| Closed | Bastovan Nick | $386,700 | |
| Closed | Bastovan Nick | $60,711 | |
| Closed | Bastovan Nick | $330,000 | |
| Closed | Bastovan Nick | $246,780 | |
| Closed | Bastovan Nick | $80,000 | |
| Closed | Bastovan Nick | $67,000 | |
| Closed | Bastovan Nick | $264,000 | |
| Closed | Bastovan Nick | $261,500 | |
| Closed | Bastovan Nick | $210,000 | |
| Closed | Bastovan Nick | $50,000 | |
| Closed | Bastovan Nick | $207,000 |
Source: Public Records
Tax History Compared to Growth
Tax History
| Year | Tax Paid | Tax Assessment Tax Assessment Total Assessment is a certain percentage of the fair market value that is determined by local assessors to be the total taxable value of land and additions on the property. | Land | Improvement |
|---|---|---|---|---|
| 2024 | $5,931 | $421,517 | $126,455 | $295,062 |
| 2023 | $5,834 | $413,254 | $123,976 | $289,278 |
| 2022 | $5,741 | $405,152 | $121,545 | $283,607 |
| 2021 | $5,618 | $397,208 | $119,162 | $278,046 |
| 2020 | $5,447 | $393,137 | $117,941 | $275,196 |
| 2019 | $5,462 | $385,431 | $115,629 | $269,802 |
| 2018 | $5,338 | $377,875 | $113,362 | $264,513 |
| 2017 | $5,195 | $370,467 | $111,140 | $259,327 |
| 2016 | $4,993 | $363,205 | $108,961 | $254,244 |
| 2015 | $4,691 | $357,751 | $107,325 | $250,426 |
| 2014 | $4,608 | $350,744 | $105,223 | $245,521 |
Source: Public Records
Map
Nearby Homes
- 618 Loyola Way
- 4588 Phyllis Ct
- 4687 Nicol Common Unit 108
- 344 Charlotte Common
- 530 Andrea Cir
- 766 Joyce St
- 318 Marie Common
- 5149 Irene Way
- 5108 Diane Ln
- 357 Lincoln Ave
- 5224 Diane Ln
- 5169 Lillian Ct
- 5191 Lillian Ct
- 4147 Stanford Way
- 642 Debra St
- 557 Debra St
- 127 Sonia Way
- 564 Debra St
- 4964 Candy Ct
- 709 Katrina St