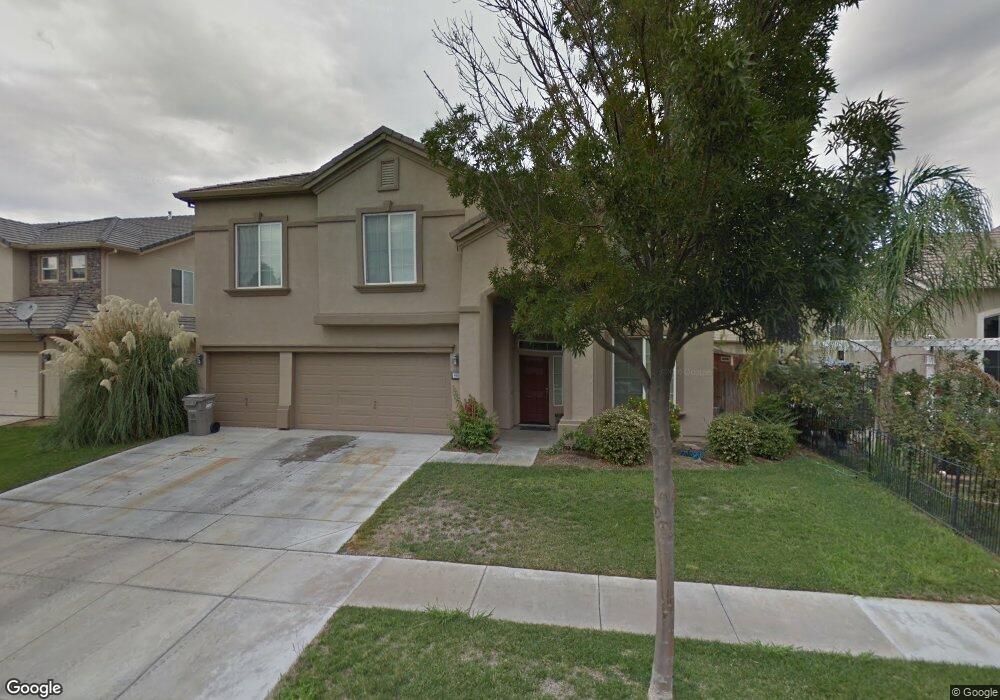
668 Poplar Ave Los Banos, CA 93635
Estimated Value: $603,000 - $619,000
5
Beds
3
Baths
3,184
Sq Ft
$192/Sq Ft
Est. Value
About This Home
This home is located at 668 Poplar Ave, Los Banos, CA 93635 and is currently estimated at $610,626, approximately $191 per square foot. 668 Poplar Ave is a home located in Merced County with nearby schools including Henry Miller Elementary School, Creekside Junior High School, and Los Banos High School.
Ownership History
Date
Name
Owned For
Owner Type
Purchase Details
Closed on
May 2, 2013
Sold by
Laforga Keith S
Bought by
Ayubzai Mohammad Yahya and Taj Shahira
Current Estimated Value
Purchase Details
Closed on
Mar 31, 2005
Sold by
Anderson Homes
Bought by
Laforga Keith S
Home Financials for this Owner
Home Financials are based on the most recent Mortgage that was taken out on this home.
Original Mortgage
$400,523
Interest Rate
6.62%
Mortgage Type
New Conventional
Create a Home Valuation Report for This Property
The Home Valuation Report is an in-depth analysis detailing your home's value as well as a comparison with similar homes in the area
Home Values in the Area
Average Home Value in this Area
Purchase History
| Date | Buyer | Sale Price | Title Company |
|---|---|---|---|
| Ayubzai Mohammad Yahya | $250,000 | Chicago Title Company | |
| Laforga Keith S | -- | Chicago Title Company | |
| Laforga Keith S | $445,500 | Alliance Title Company |
Source: Public Records
Mortgage History
| Date | Status | Borrower | Loan Amount |
|---|---|---|---|
| Previous Owner | Laforga Keith S | $400,523 |
Source: Public Records
Tax History Compared to Growth
Tax History
| Year | Tax Paid | Tax Assessment Tax Assessment Total Assessment is a certain percentage of the fair market value that is determined by local assessors to be the total taxable value of land and additions on the property. | Land | Improvement |
|---|---|---|---|---|
| 2025 | $4,151 | $307,846 | $18,468 | $289,378 |
| 2024 | $4,151 | $301,810 | $18,106 | $283,704 |
| 2023 | $3,919 | $295,893 | $17,751 | $278,142 |
| 2022 | $3,830 | $290,092 | $17,403 | $272,689 |
| 2021 | $3,765 | $284,405 | $17,062 | $267,343 |
| 2020 | $3,706 | $281,490 | $16,888 | $264,602 |
| 2019 | $3,630 | $275,971 | $16,557 | $259,414 |
| 2018 | $3,520 | $270,561 | $16,233 | $254,328 |
| 2017 | $3,470 | $265,257 | $15,915 | $249,342 |
| 2016 | $3,476 | $260,056 | $15,603 | $244,453 |
| 2015 | $3,390 | $256,151 | $15,369 | $240,782 |
| 2014 | $3,287 | $251,134 | $15,068 | $236,066 |
Source: Public Records
Map
Nearby Homes