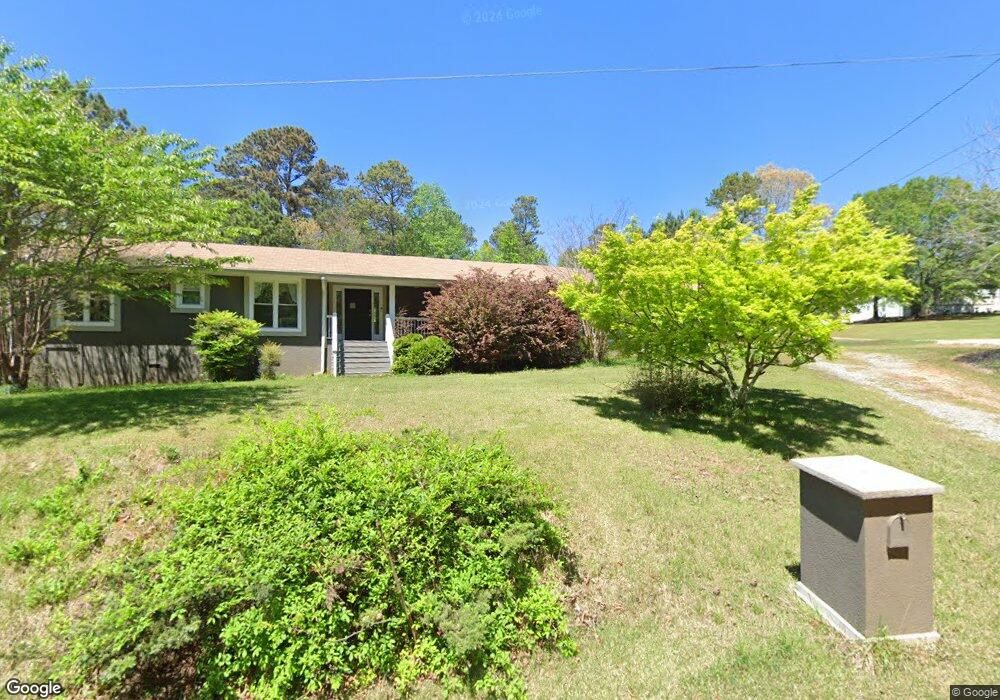
6685 Bennett Rd Cumming, GA 30041
Lake Lanier NeighborhoodEstimated Value: $387,000 - $427,000
3
Beds
2
Baths
1,799
Sq Ft
$222/Sq Ft
Est. Value
About This Home
This home is located at 6685 Bennett Rd, Cumming, GA 30041 and is currently estimated at $399,038, approximately $221 per square foot. 6685 Bennett Rd is a home located in Forsyth County with nearby schools including Chestatee Elementary School and North Forsyth Middle School.
Ownership History
Date
Name
Owned For
Owner Type
Purchase Details
Closed on
Apr 1, 2019
Sold by
Better Holdings Llc
Bought by
Blue Planet Properties Llc
Current Estimated Value
Purchase Details
Closed on
Jun 6, 2017
Sold by
Of Hud
Bought by
Better Holdings Llc
Purchase Details
Closed on
Apr 9, 2014
Sold by
Jpmorgan Chase Bank Na
Bought by
Secretary Of Housing And Urban and C/O Michaelson Connor & Boul I
Purchase Details
Closed on
Oct 30, 2009
Sold by
Hud & Housing Of Urban Dev
Bought by
Chase Hm Fin Llc
Purchase Details
Closed on
Oct 7, 2008
Sold by
Chase Hm Fin Llc
Bought by
Hud & Housing Of Urban Dev
Purchase Details
Closed on
Jul 31, 2002
Sold by
Christopher Andrew Llc
Bought by
Raygoza Martin and Raygoza Maria
Home Financials for this Owner
Home Financials are based on the most recent Mortgage that was taken out on this home.
Original Mortgage
$133,331
Interest Rate
6.27%
Mortgage Type
FHA
Create a Home Valuation Report for This Property
The Home Valuation Report is an in-depth analysis detailing your home's value as well as a comparison with similar homes in the area
Home Values in the Area
Average Home Value in this Area
Purchase History
| Date | Buyer | Sale Price | Title Company |
|---|---|---|---|
| Blue Planet Properties Llc | -- | -- | |
| Better Holdings Llc | $40,000 | -- | |
| Secretary Of Housing And Urban | $137,118 | -- | |
| Chase Hm Fin Llc | -- | -- | |
| Hud & Housing Of Urban Dev | -- | -- | |
| Chase Hm Fin Llc | $149,947 | -- | |
| Raygoza Martin | $135,400 | -- |
Source: Public Records
Mortgage History
| Date | Status | Borrower | Loan Amount |
|---|---|---|---|
| Previous Owner | Raygoza Martin | $133,331 |
Source: Public Records
Tax History Compared to Growth
Tax History
| Year | Tax Paid | Tax Assessment Tax Assessment Total Assessment is a certain percentage of the fair market value that is determined by local assessors to be the total taxable value of land and additions on the property. | Land | Improvement |
|---|---|---|---|---|
| 2025 | $3,160 | $140,280 | $57,720 | $82,560 |
| 2024 | $3,160 | $128,844 | $48,284 | $80,560 |
| 2023 | $3,033 | $123,220 | $46,620 | $76,600 |
| 2022 | $2,681 | $83,392 | $28,512 | $54,880 |
| 2021 | $2,303 | $83,392 | $28,512 | $54,880 |
| 2020 | $2,218 | $80,312 | $28,512 | $51,800 |
| 2019 | $1,978 | $71,544 | $20,064 | $51,480 |
| 2018 | $1,558 | $56,344 | $20,064 | $36,280 |
| 2017 | $1,399 | $50,400 | $15,840 | $34,560 |
| 2016 | $1,311 | $47,232 | $0 | $0 |
| 2015 | $1,313 | $47,232 | $12,672 | $34,560 |
| 2014 | $1,178 | $44,512 | $0 | $0 |
Source: Public Records
Map
Nearby Homes
- 6865 N Creekside Point
- 6765 Creek View Ln
- 6945 W Mountain Crossing
- 6515 Mountain Vista Ct
- 6370 Stillwood Ln
- 6745 Payton Rd
- 55 Summit Ridge Chase
- 5110 Kongoni Ct
- 7060 Summit Ridge Chase
- 5385 Old Haven Ct
- 7120 Hampton Creek Dr
- 6245 Hampton Golf Club Dr
- 0 Ga 400 Hwy Unit 10418657
- 6235 Hampton Golf Club Dr
- 6625 Oak Highlands Ct
- 5935 Whitney Ct
- 5925 Whitney Ct
- 6675 Bennett Rd
- 6725 Bennett Rd
- 6645 Bennett Rd
- 6641 Scotland Cir
- 6707 Bennett Rd
- 6707 Bennett Rd
- 6735 Bennett Rd
- 6707 Bennett Rd
- 6707A Bennett Rd
- 6655 Bennett Rd
- 6755 Bennett Rd
- 6830 Bennett Rd
- 6645 Scotland Cir
- 6642 Scotland Cir
- 6794 Bennett Rd
- 000 Bennett Rd
- 9 Bennett Rd
- 0000 Bennett Rd
- 6635 Bennett Rd
- 6635 Bennett Rd