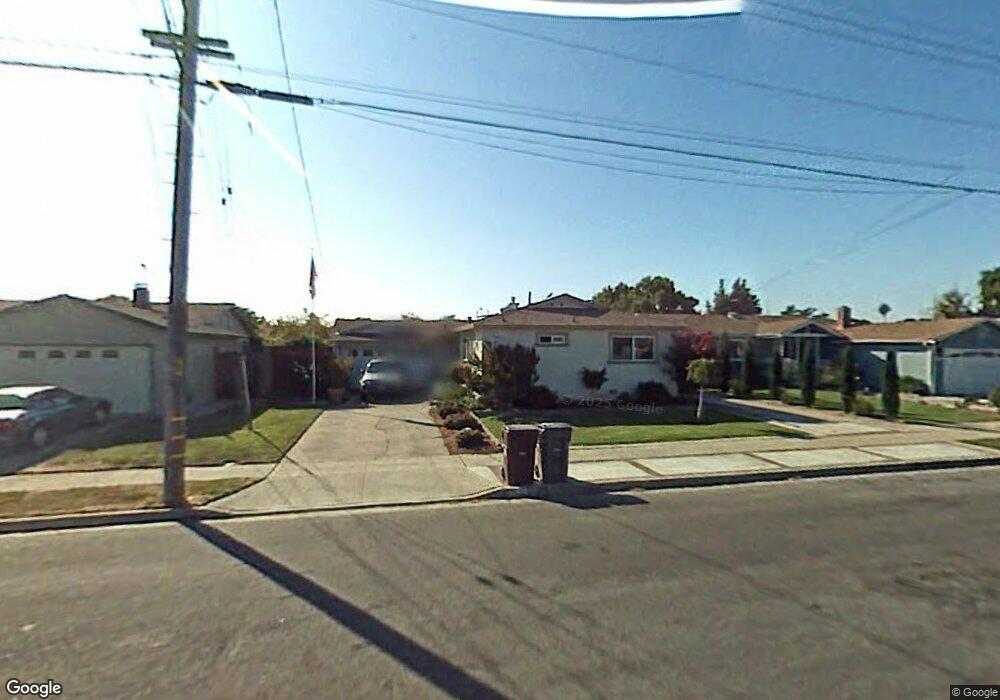
6688 Fountaine Ave Newark, CA 94560
Estimated Value: $1,081,000 - $1,251,000
3
Beds
2
Baths
1,386
Sq Ft
$823/Sq Ft
Est. Value
About This Home
This home is located at 6688 Fountaine Ave, Newark, CA 94560 and is currently estimated at $1,140,070, approximately $822 per square foot. 6688 Fountaine Ave is a home located in Alameda County with nearby schools including Coyote Hills Elementary School, Newark Junior High School, and Newark Memorial High School.
Ownership History
Date
Name
Owned For
Owner Type
Purchase Details
Closed on
Feb 3, 2011
Sold by
Lunde Carsten H and Lunde Janet
Bought by
Lunde Carsten H and Lunde Janet
Current Estimated Value
Purchase Details
Closed on
Nov 18, 2004
Sold by
Lunde Janet
Bought by
Lunde Carsten H and Lunde Janet
Home Financials for this Owner
Home Financials are based on the most recent Mortgage that was taken out on this home.
Original Mortgage
$459,500
Outstanding Balance
$209,381
Interest Rate
4.49%
Mortgage Type
Purchase Money Mortgage
Estimated Equity
$930,689
Purchase Details
Closed on
Jan 11, 1999
Sold by
Lunde Carsten H
Bought by
Lunde Janet
Home Financials for this Owner
Home Financials are based on the most recent Mortgage that was taken out on this home.
Original Mortgage
$215,000
Interest Rate
6.66%
Create a Home Valuation Report for This Property
The Home Valuation Report is an in-depth analysis detailing your home's value as well as a comparison with similar homes in the area
Home Values in the Area
Average Home Value in this Area
Purchase History
| Date | Buyer | Sale Price | Title Company |
|---|---|---|---|
| Lunde Carsten H | -- | None Available | |
| Lunde Carsten H | -- | Fidelity National Title Co | |
| Lunde Janet | -- | Old Republic Title Company |
Source: Public Records
Mortgage History
| Date | Status | Borrower | Loan Amount |
|---|---|---|---|
| Open | Lunde Carsten H | $459,500 | |
| Closed | Lunde Janet | $215,000 |
Source: Public Records
Tax History Compared to Growth
Tax History
| Year | Tax Paid | Tax Assessment Tax Assessment Total Assessment is a certain percentage of the fair market value that is determined by local assessors to be the total taxable value of land and additions on the property. | Land | Improvement |
|---|---|---|---|---|
| 2025 | $3,502 | $242,823 | $94,755 | $148,068 |
| 2024 | $3,502 | $238,063 | $92,898 | $145,165 |
| 2023 | $3,392 | $233,395 | $91,076 | $142,319 |
| 2022 | $3,328 | $228,820 | $89,291 | $139,529 |
| 2021 | $3,250 | $224,333 | $87,540 | $136,793 |
| 2020 | $3,146 | $222,034 | $86,643 | $135,391 |
| 2019 | $3,106 | $217,681 | $84,944 | $132,737 |
| 2018 | $3,055 | $213,414 | $83,279 | $130,135 |
| 2017 | $2,978 | $209,229 | $81,646 | $127,583 |
| 2016 | $2,935 | $205,127 | $80,045 | $125,082 |
| 2015 | $2,924 | $202,046 | $78,843 | $123,203 |
| 2014 | $2,841 | $198,089 | $77,299 | $120,790 |
Source: Public Records
Map
Nearby Homes
- 6784 Montcalm Ave
- 36466 Haley St
- 36184 Toulouse St
- 36383 Colbert St
- 36523 Cherry St
- 36535 Mulberry St
- 36563 Beutke Dr
- 36621 Beutke Dr
- 6831 Cabernet Ave
- 36701 Olive St
- 36593 Leone St
- 7698 Redbud Ct
- 36146 Indian Wells Dr
- 6234 Zulmida Ave
- 6364 Noel Ave
- 7574 Birkdale Dr
- 6025 Radcliffe Ave
- 6875 Normandy Dr
- 6189 Thornton Ave Unit C
- 6740 Normandy Dr
- 6716 Fountaine Ave
- 6674 Fountaine Ave
- 36340 La Salle Dr
- 36344 La Salle Dr
- 6738 Fountaine Ave
- 6660 Fountaine Ave
- 36336 La Salle Dr
- 36307 Concord St
- 36289 Toulon Place
- 36290 Toulon Place
- 6764 Fountaine Ave
- 36326 La Salle Dr
- 36352 La Salle Dr
- 36313 Concord St
- 6737 Fountaine Ave
- 6659 Fountaine Ave
- 6763 Fountaine Ave
- 6633 Fountaine Ave
- 36327 Concord St
- 36302 La Salle Dr