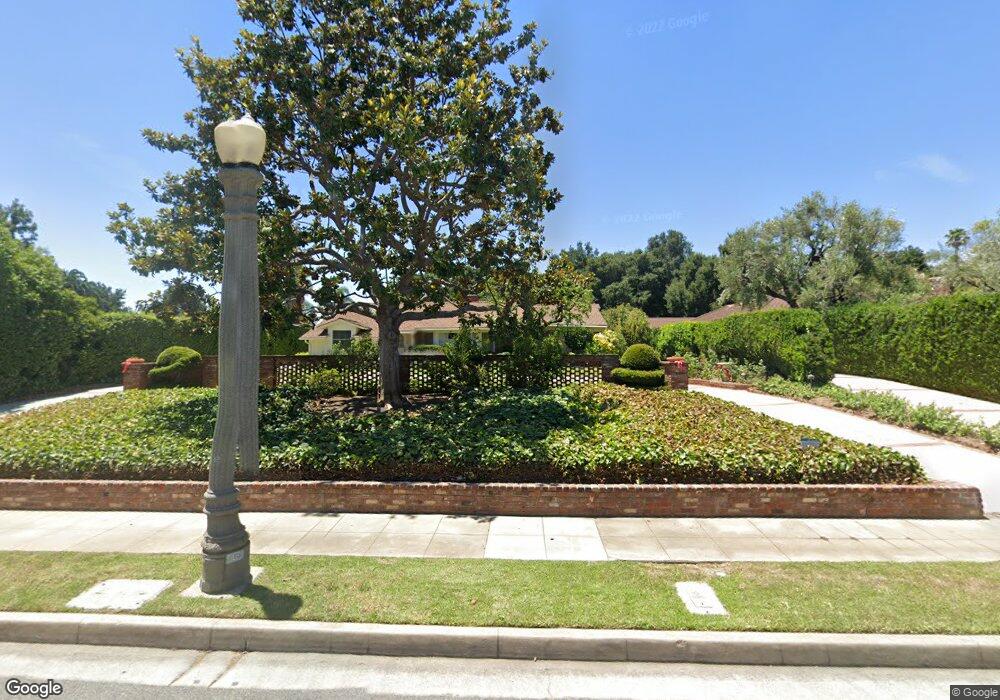
669 Sierra Madre Blvd San Marino, CA 91108
Estimated Value: $3,232,000 - $3,662,000
4
Beds
5
Baths
3,382
Sq Ft
$1,035/Sq Ft
Est. Value
About This Home
This home is located at 669 Sierra Madre Blvd, San Marino, CA 91108 and is currently estimated at $3,499,393, approximately $1,034 per square foot. 669 Sierra Madre Blvd is a home located in Los Angeles County with nearby schools including Carver Elementary, Huntington Middle School, and San Marino High School.
Ownership History
Date
Name
Owned For
Owner Type
Purchase Details
Closed on
Mar 30, 2018
Sold by
Chen Lina Li Ming
Bought by
Chen Lina Li Ming and Lina L Chen Living Trust
Current Estimated Value
Purchase Details
Closed on
Mar 28, 2018
Sold by
Chen Lina L
Bought by
Chen Lina Li Ming
Purchase Details
Closed on
Sep 25, 2003
Sold by
Chen Pao Sui
Bought by
Chen Pao Sui and Pao Sui Chen 2003 Family Trust
Purchase Details
Closed on
Aug 14, 1997
Sold by
Cohen David A
Bought by
Chen Yin Chin and Chen Danny Y
Purchase Details
Closed on
Feb 3, 1997
Sold by
Cohen Robert Nathan
Bought by
Cohen David A
Home Financials for this Owner
Home Financials are based on the most recent Mortgage that was taken out on this home.
Original Mortgage
$478,000
Interest Rate
7.66%
Purchase Details
Closed on
Nov 15, 1996
Sold by
Cohen David A
Bought by
Cohen David A and Cohen Robert Nathan
Create a Home Valuation Report for This Property
The Home Valuation Report is an in-depth analysis detailing your home's value as well as a comparison with similar homes in the area
Home Values in the Area
Average Home Value in this Area
Purchase History
| Date | Buyer | Sale Price | Title Company |
|---|---|---|---|
| Chen Lina Li Ming | -- | None Available | |
| Chen Lina Li Ming | -- | None Available | |
| Chen Pao Sui | -- | -- | |
| Chen Yin Chin | $676,500 | -- | |
| Cohen David A | -- | Chicago Title | |
| Cohen David A | -- | Chicago Title | |
| Cohen Robert Nathan | -- | Chicago Title | |
| Cohen David A | -- | First American Title |
Source: Public Records
Mortgage History
| Date | Status | Borrower | Loan Amount |
|---|---|---|---|
| Previous Owner | Cohen David A | $478,000 |
Source: Public Records
Tax History Compared to Growth
Tax History
| Year | Tax Paid | Tax Assessment Tax Assessment Total Assessment is a certain percentage of the fair market value that is determined by local assessors to be the total taxable value of land and additions on the property. | Land | Improvement |
|---|---|---|---|---|
| 2025 | $16,865 | $1,264,906 | $864,166 | $400,740 |
| 2024 | $16,865 | $1,240,105 | $847,222 | $392,883 |
| 2023 | $16,524 | $1,215,790 | $830,610 | $385,180 |
| 2022 | $16,026 | $1,191,952 | $814,324 | $377,628 |
| 2021 | $15,734 | $1,168,581 | $798,357 | $370,224 |
| 2019 | $15,281 | $1,133,922 | $774,678 | $359,244 |
| 2018 | $14,821 | $1,111,689 | $759,489 | $352,200 |
| 2016 | $14,198 | $1,068,524 | $729,999 | $338,525 |
| 2015 | $13,961 | $1,052,475 | $719,034 | $333,441 |
| 2014 | $13,794 | $1,031,860 | $704,950 | $326,910 |
Source: Public Records
Map
Nearby Homes
- 627 Winston Ave
- 565 Sierra Madre Blvd
- 500 Sierra Vista Ave
- 935 Sierra Madre Blvd
- 670 San Marino Ave
- 375 S Sierra Madre Blvd Unit B
- 2110 Homet Rd
- 989 Winston Ave
- 2065 Oakdale St
- 2386 E Del Mar Blvd Unit 226
- 2786 E California Blvd
- 188 S Sierra Madre Blvd Unit 10
- 188 S Sierra Madre Blvd Unit 8
- 1886 San Pasqual St
- 168 S Sierra Madre Blvd Unit 115
- 175 S Sierra Madre Blvd
- 2964 Lombardy Rd
- 1200 Oakwood Dr
- 177 S Altadena Dr
- 2976 Lombardy Rd
- 653 Sierra Madre Blvd
- 2375 Lombardy Rd
- 637 Sierra Madre Blvd
- 674 Chaucer Rd
- 690 Chaucer Rd
- 658 Chaucer Rd
- 621 Sierra Madre Blvd
- 2370 Lombardy Rd
- 642 Chaucer Rd
- 668 Sierra Madre Blvd
- 680 Sierra Madre Blvd
- 656 Sierra Madre Blvd
- 710 Chaucer Rd
- 2425 Lombardy Rd
- 644 Sierra Madre Blvd
- 605 Sierra Madre Blvd
- 626 Chaucer Rd
- 632 Sierra Madre Blvd
- 725 Sierra Madre Blvd
- 730 Chaucer Rd