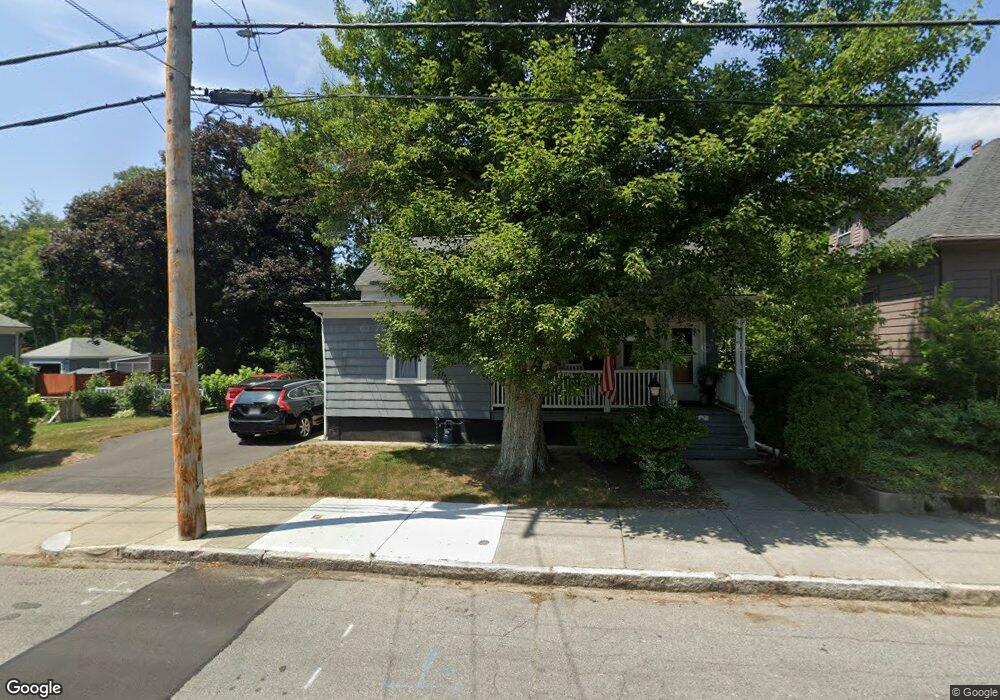
67 George St Attleboro, MA 02703
Estimated Value: $313,000 - $454,000
2
Beds
1
Bath
900
Sq Ft
$411/Sq Ft
Est. Value
About This Home
This home is located at 67 George St, Attleboro, MA 02703 and is currently estimated at $370,306, approximately $411 per square foot. 67 George St is a home located in Bristol County with nearby schools including Peter Thacher Elementary School, Wamsutta Middle School, and Attleboro High School.
Ownership History
Date
Name
Owned For
Owner Type
Purchase Details
Closed on
Jun 3, 2020
Sold by
Holske Lincoln S and Holske Sadnra L
Bought by
Holske Lincoln
Current Estimated Value
Purchase Details
Closed on
Mar 31, 2017
Sold by
Wallace Richard J and Wallace Diana L
Bought by
Holske Lincoln S and Holske Sandra L
Purchase Details
Closed on
Jul 17, 2015
Sold by
Wallace Sarah P
Bought by
Wallace Diana L and Wallace Richard J
Create a Home Valuation Report for This Property
The Home Valuation Report is an in-depth analysis detailing your home's value as well as a comparison with similar homes in the area
Home Values in the Area
Average Home Value in this Area
Purchase History
| Date | Buyer | Sale Price | Title Company |
|---|---|---|---|
| Holske Lincoln | $164,375 | None Available | |
| Holske Lincoln S | $125,000 | -- | |
| Wallace Diana L | -- | -- |
Source: Public Records
Tax History
| Year | Tax Paid | Tax Assessment Tax Assessment Total Assessment is a certain percentage of the fair market value that is determined by local assessors to be the total taxable value of land and additions on the property. | Land | Improvement |
|---|---|---|---|---|
| 2025 | $3,722 | $296,600 | $135,100 | $161,500 |
| 2024 | $3,754 | $294,900 | $135,100 | $159,800 |
| 2023 | $3,455 | $252,400 | $122,800 | $129,600 |
| 2022 | $3,549 | $245,600 | $116,900 | $128,700 |
| 2021 | $3,490 | $235,800 | $112,400 | $123,400 |
| 2020 | $3,208 | $220,300 | $109,200 | $111,100 |
| 2019 | $2,945 | $208,000 | $107,100 | $100,900 |
| 2018 | $2,814 | $189,900 | $104,000 | $85,900 |
| 2017 | $2,641 | $181,500 | $104,000 | $77,500 |
| 2016 | $2,599 | $175,400 | $102,100 | $73,300 |
| 2015 | $2,421 | $164,600 | $102,100 | $62,500 |
| 2014 | $2,272 | $153,000 | $97,100 | $55,900 |
Source: Public Records
Map
Nearby Homes
- 95 Mulberry St
- 91 East St
- 17 Davis Ave
- 567 Park St
- 61 Pine St Unit 9
- 45 Holman St
- 37 Holman St
- 28 Pine St Unit C
- 17 Capron St
- 67 Steeple Chase Cir Unit 1
- 32 Park St Unit 4
- 0 Rosedale Ln Unit 73469293
- 147 County St
- 0 Cherry Tree Ln
- 18-20 Jefferson St
- 21 4th St
- 35 Christopher Dr
- 49 Dennis St
- 64 Mechanic St Unit 3
- 64 Mechanic St
Your Personal Tour Guide
Ask me questions while you tour the home.