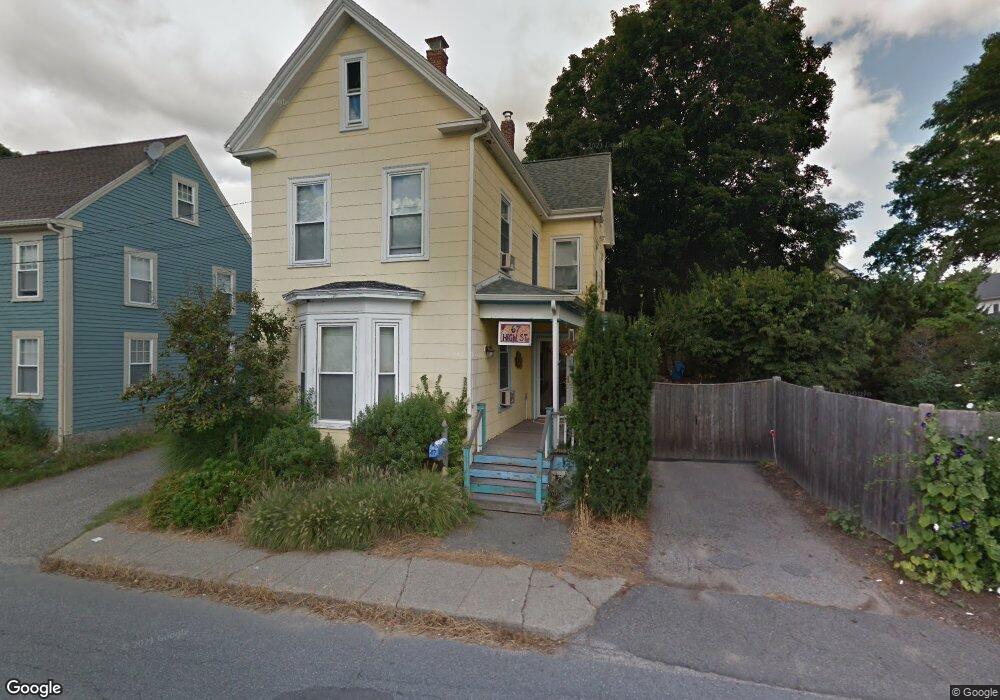
67 High St Amesbury, MA 01913
Estimated Value: $648,240 - $743,000
3
Beds
2
Baths
1,895
Sq Ft
$363/Sq Ft
Est. Value
About This Home
This home is located at 67 High St, Amesbury, MA 01913 and is currently estimated at $687,560, approximately $362 per square foot. 67 High St is a home located in Essex County with nearby schools including Amesbury High School and Amesbury Seventh-Day Adventist School.
Ownership History
Date
Name
Owned For
Owner Type
Purchase Details
Closed on
Jul 2, 1990
Sold by
Selinger Robert D
Bought by
Camilliere Joseph
Current Estimated Value
Home Financials for this Owner
Home Financials are based on the most recent Mortgage that was taken out on this home.
Original Mortgage
$126,168
Interest Rate
10.27%
Mortgage Type
Purchase Money Mortgage
Purchase Details
Closed on
May 20, 1988
Sold by
Malfatone Frank
Bought by
Selinger Robert D
Create a Home Valuation Report for This Property
The Home Valuation Report is an in-depth analysis detailing your home's value as well as a comparison with similar homes in the area
Home Values in the Area
Average Home Value in this Area
Purchase History
| Date | Buyer | Sale Price | Title Company |
|---|---|---|---|
| Camilliere Joseph | $125,000 | -- | |
| Selinger Robert D | $136,000 | -- |
Source: Public Records
Mortgage History
| Date | Status | Borrower | Loan Amount |
|---|---|---|---|
| Open | Selinger Robert D | $109,300 | |
| Closed | Selinger Robert D | $123,600 | |
| Closed | Selinger Robert D | $126,168 | |
| Previous Owner | Selinger Robert D | $10,900 |
Source: Public Records
Tax History Compared to Growth
Tax History
| Year | Tax Paid | Tax Assessment Tax Assessment Total Assessment is a certain percentage of the fair market value that is determined by local assessors to be the total taxable value of land and additions on the property. | Land | Improvement |
|---|---|---|---|---|
| 2025 | $7,558 | $494,000 | $200,300 | $293,700 |
| 2024 | $7,129 | $455,800 | $188,900 | $266,900 |
| 2023 | $7,046 | $431,200 | $164,300 | $266,900 |
| 2022 | $6,418 | $362,800 | $142,800 | $220,000 |
| 2021 | $6,349 | $347,900 | $110,300 | $237,600 |
| 2020 | $5,678 | $330,500 | $106,100 | $224,400 |
| 2019 | $5,641 | $307,100 | $106,100 | $201,000 |
| 2018 | $5,424 | $285,600 | $101,100 | $184,500 |
| 2017 | $5,147 | $258,000 | $101,100 | $156,900 |
| 2016 | $5,094 | $251,200 | $101,100 | $150,100 |
| 2015 | $4,989 | $242,900 | $101,100 | $141,800 |
| 2014 | $4,777 | $227,800 | $101,100 | $126,700 |
Source: Public Records
Map
Nearby Homes
- 81 High St Unit 27
- 37 Millyard Unit 204
- 48 Orchard St
- 17 Linwood Place
- 53 Market St
- 19 Perkins St
- 101 Market St Unit B
- 101 Market St Unit A
- 103 Market St Unit A
- 103 Market St Unit B
- 105 Market St Unit B
- 4 Lincoln Ct
- 25 Cedar St Unit 4
- 25 Cedar St Unit 7
- 24 Aubin St Unit 2
- 5 Richs Ct Unit 3
- 13 Lincoln Ct
- 17 Lincoln Ct
- 129 Friend St
- 43 Aubin St Unit 1