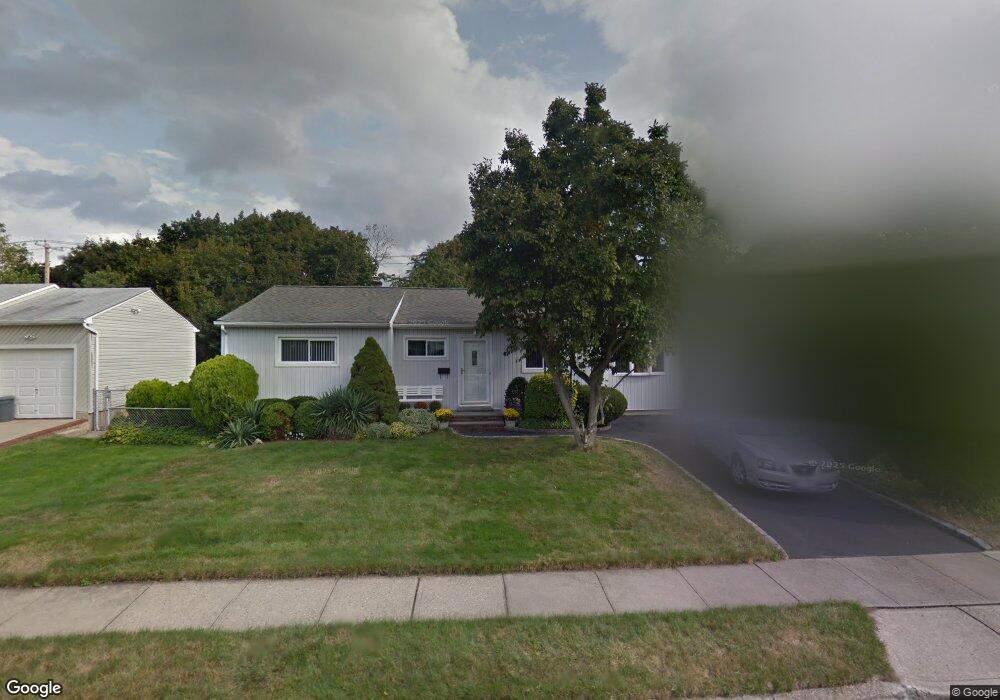
67 Hope Dr Plainview, NY 11803
Estimated Value: $777,000 - $834,129
3
Beds
2
Baths
1,158
Sq Ft
$696/Sq Ft
Est. Value
About This Home
This home is located at 67 Hope Dr, Plainview, NY 11803 and is currently estimated at $805,565, approximately $695 per square foot. 67 Hope Dr is a home located in Nassau County with nearby schools including Pasadena Elementary School, Plainview Old Bethpage Middle School, and Plainview-Old Bethpage John F. Kennedy High School.
Ownership History
Date
Name
Owned For
Owner Type
Purchase Details
Closed on
Sep 13, 2018
Sold by
Gelber Stacy and Borowka Stacy
Bought by
Gelber Jordan
Current Estimated Value
Home Financials for this Owner
Home Financials are based on the most recent Mortgage that was taken out on this home.
Original Mortgage
$436,000
Outstanding Balance
$380,252
Interest Rate
4.6%
Mortgage Type
New Conventional
Estimated Equity
$425,313
Purchase Details
Closed on
Dec 19, 2013
Sold by
Kuhne William W and Kuhne Linda S
Bought by
Gelber Stacy
Home Financials for this Owner
Home Financials are based on the most recent Mortgage that was taken out on this home.
Original Mortgage
$336,150
Interest Rate
4.24%
Mortgage Type
Purchase Money Mortgage
Create a Home Valuation Report for This Property
The Home Valuation Report is an in-depth analysis detailing your home's value as well as a comparison with similar homes in the area
Home Values in the Area
Average Home Value in this Area
Purchase History
| Date | Buyer | Sale Price | Title Company |
|---|---|---|---|
| Gelber Jordan | $545,000 | None Available | |
| Gelber Stacy | $405,000 | -- |
Source: Public Records
Mortgage History
| Date | Status | Borrower | Loan Amount |
|---|---|---|---|
| Open | Gelber Jordan | $436,000 | |
| Previous Owner | Gelber Stacy | $336,150 |
Source: Public Records
Tax History
| Year | Tax Paid | Tax Assessment Tax Assessment Total Assessment is a certain percentage of the fair market value that is determined by local assessors to be the total taxable value of land and additions on the property. | Land | Improvement |
|---|---|---|---|---|
| 2025 | $13,782 | $464 | $259 | $205 |
| 2024 | $4,215 | $500 | $279 | $221 |
Source: Public Records
Map
Nearby Homes
Your Personal Tour Guide
Ask me questions while you tour the home.