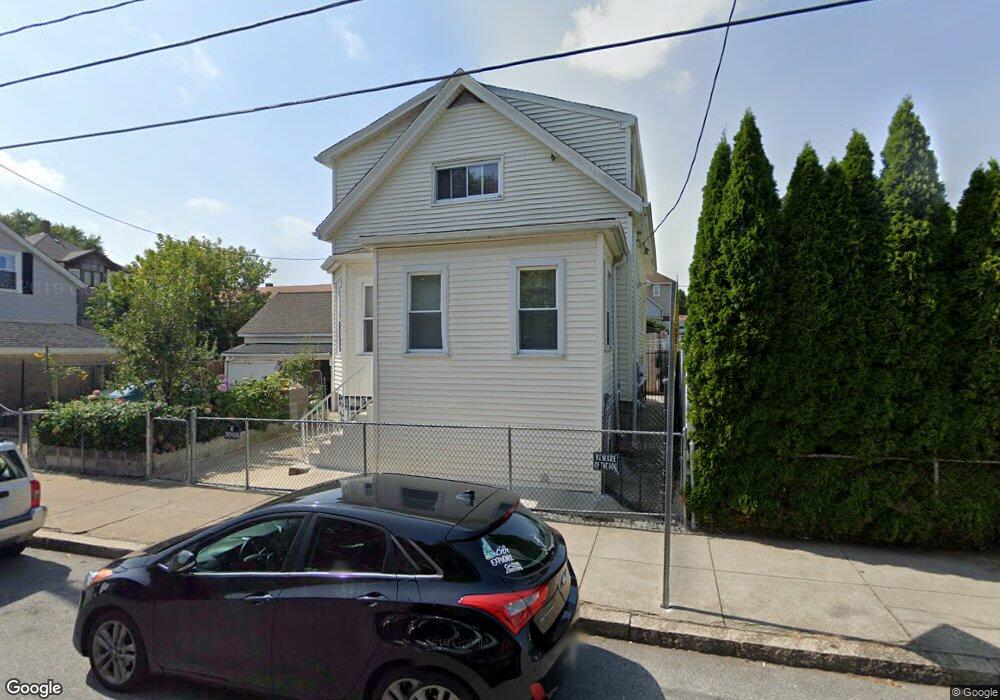
67 Lapham St Fall River, MA 02721
Niagara NeighborhoodEstimated Value: $245,000 - $372,000
2
Beds
1
Bath
1,042
Sq Ft
$309/Sq Ft
Est. Value
About This Home
This home is located at 67 Lapham St, Fall River, MA 02721 and is currently estimated at $321,984, approximately $309 per square foot. 67 Lapham St is a home located in Bristol County with nearby schools including William S Greene, Matthew J. Kuss Middle School, and B M C Durfee High School.
Ownership History
Date
Name
Owned For
Owner Type
Purchase Details
Closed on
Dec 30, 2019
Sold by
Carvalho Jose P and Carvalho Lucia M
Bought by
Carvalho Jose and Carvalho Arnaldo
Current Estimated Value
Purchase Details
Closed on
Aug 13, 1990
Sold by
Cook James E Est
Bought by
Carvalho Jose
Home Financials for this Owner
Home Financials are based on the most recent Mortgage that was taken out on this home.
Original Mortgage
$97,000
Interest Rate
10.04%
Mortgage Type
Purchase Money Mortgage
Create a Home Valuation Report for This Property
The Home Valuation Report is an in-depth analysis detailing your home's value as well as a comparison with similar homes in the area
Home Values in the Area
Average Home Value in this Area
Purchase History
| Date | Buyer | Sale Price | Title Company |
|---|---|---|---|
| Carvalho Jose | -- | None Available | |
| Carvalho Jose | $102,500 | -- |
Source: Public Records
Mortgage History
| Date | Status | Borrower | Loan Amount |
|---|---|---|---|
| Previous Owner | Carvalho Jose | $12,209 | |
| Previous Owner | Carvalho Jose | $97,000 |
Source: Public Records
Tax History
| Year | Tax Paid | Tax Assessment Tax Assessment Total Assessment is a certain percentage of the fair market value that is determined by local assessors to be the total taxable value of land and additions on the property. | Land | Improvement |
|---|---|---|---|---|
| 2025 | $3,551 | $310,100 | $105,500 | $204,600 |
| 2024 | $3,357 | $292,200 | $101,600 | $190,600 |
| 2023 | $3,229 | $263,200 | $84,000 | $179,200 |
| 2022 | $2,899 | $229,700 | $80,000 | $149,700 |
| 2021 | $2,755 | $199,200 | $76,100 | $123,100 |
| 2020 | $2,610 | $180,600 | $75,000 | $105,600 |
| 2019 | $2,537 | $174,000 | $72,200 | $101,800 |
| 2018 | $2,532 | $173,200 | $78,200 | $95,000 |
| 2017 | $2,349 | $167,800 | $74,500 | $93,300 |
| 2016 | $2,287 | $167,800 | $79,300 | $88,500 |
| 2015 | $2,195 | $167,800 | $79,300 | $88,500 |
| 2014 | $2,082 | $165,500 | $77,000 | $88,500 |
Source: Public Records
Map
Nearby Homes
- 304 Cambridge St
- 405 Warren St
- 231 Lapham St
- 71 Smith St
- 472 Buffinton St
- 472 Buffinton St (Ns)
- 311 S Oxford St
- 11 Foster St
- 1350 Rodman St
- 364 Tecumseh St
- 94 Snell St
- 21 Boyden St
- 545 Brayton Ave
- 20 Reeves St
- 000 Lawrence St
- 1-11 Lawrence St
- 188-194 Nashua St
- 1 Lawrence St Unit 1
- 132 Lonsdale St
- 10 Aberdeen St
Your Personal Tour Guide
Ask me questions while you tour the home.