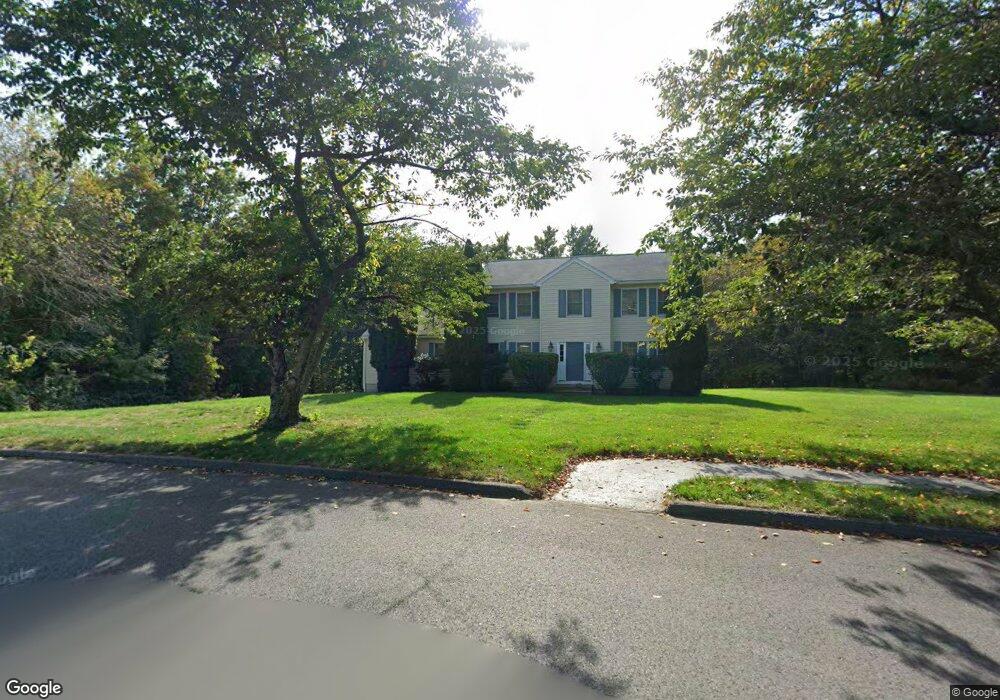
67 Laurel Dr Hudson, MA 01749
Estimated Value: $802,435 - $882,000
4
Beds
3
Baths
2,496
Sq Ft
$338/Sq Ft
Est. Value
About This Home
This home is located at 67 Laurel Dr, Hudson, MA 01749 and is currently estimated at $844,609, approximately $338 per square foot. 67 Laurel Dr is a home located in Middlesex County with nearby schools including David J. Quinn Middle School, Hudson High School, and Darnell School For Educational & Behavioral Service.
Ownership History
Date
Name
Owned For
Owner Type
Purchase Details
Closed on
Oct 22, 1999
Sold by
Maple Grove Dev Inc
Bought by
White Ronald R
Current Estimated Value
Home Financials for this Owner
Home Financials are based on the most recent Mortgage that was taken out on this home.
Original Mortgage
$226,400
Interest Rate
7.83%
Mortgage Type
Purchase Money Mortgage
Create a Home Valuation Report for This Property
The Home Valuation Report is an in-depth analysis detailing your home's value as well as a comparison with similar homes in the area
Home Values in the Area
Average Home Value in this Area
Purchase History
| Date | Buyer | Sale Price | Title Company |
|---|---|---|---|
| White Ronald R | $283,000 | -- |
Source: Public Records
Mortgage History
| Date | Status | Borrower | Loan Amount |
|---|---|---|---|
| Open | White Ronald R | $206,200 | |
| Closed | White Ronald R | $226,400 | |
| Previous Owner | White Ronald R | $150,000 |
Source: Public Records
Tax History Compared to Growth
Tax History
| Year | Tax Paid | Tax Assessment Tax Assessment Total Assessment is a certain percentage of the fair market value that is determined by local assessors to be the total taxable value of land and additions on the property. | Land | Improvement |
|---|---|---|---|---|
| 2025 | $10,046 | $723,800 | $243,200 | $480,600 |
| 2024 | $9,792 | $699,400 | $220,800 | $478,600 |
| 2023 | $8,886 | $608,600 | $212,700 | $395,900 |
| 2022 | $8,706 | $548,900 | $193,300 | $355,600 |
| 2021 | $7,953 | $499,500 | $184,200 | $315,300 |
| 2020 | $8,240 | $496,100 | $180,800 | $315,300 |
| 2019 | $22,663 | $475,700 | $180,800 | $294,900 |
| 2018 | $7,894 | $451,100 | $172,200 | $278,900 |
| 2017 | $20,065 | $429,500 | $164,000 | $265,500 |
| 2016 | $7,009 | $405,400 | $164,000 | $241,400 |
| 2015 | $6,772 | $392,100 | $159,300 | $232,800 |
| 2014 | $6,482 | $372,100 | $139,700 | $232,400 |
Source: Public Records
Map
Nearby Homes
- 223 Central St
- 133 Lincoln St
- 55 Cottage St
- 104 Lincoln St
- 3 Highland Park Ave
- 1 Barracks Rd Unit 1
- 30 Maple St
- 37 Teresa Rd
- 4 Linden St
- 25 Old Stone Cir
- 21 Gates Ave
- 18-24 River St Unit 1
- 315 Central St
- 74 Cox St Unit 9
- 0 Mill Pond Rd Unit 73442819
- 200 Manning St Unit 6C
- 200 Manning St Unit 14B
- 65 Main St
- 243 Gates Pond Rd
- 322 Central St