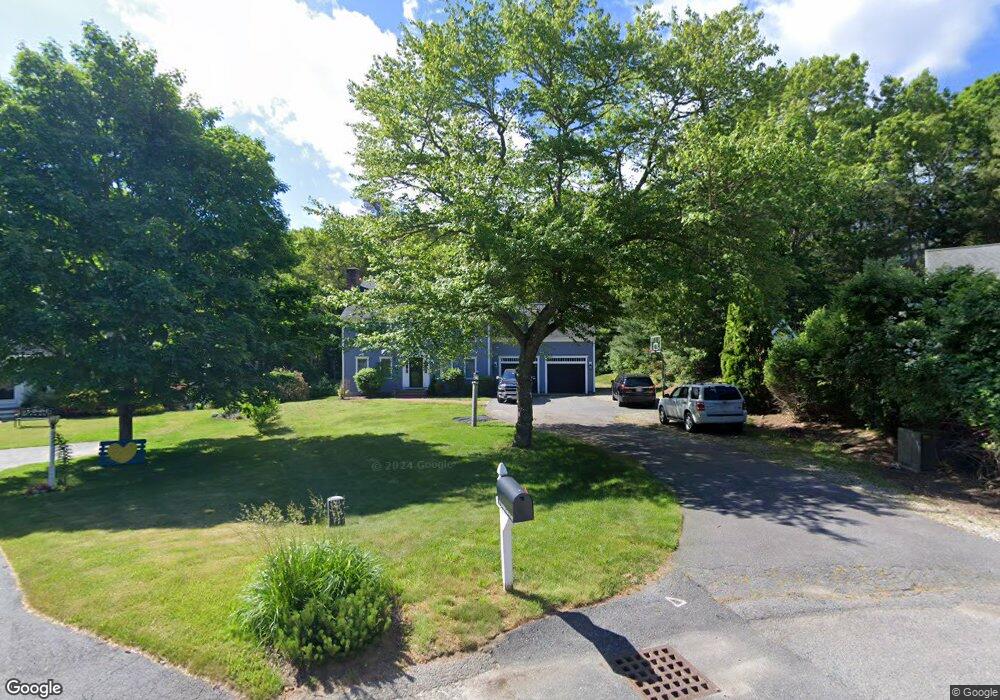
67 Morgan Way West Barnstable, MA 02668
West Barnstable NeighborhoodEstimated Value: $707,613 - $886,000
3
Beds
3
Baths
1,801
Sq Ft
$434/Sq Ft
Est. Value
About This Home
This home is located at 67 Morgan Way, West Barnstable, MA 02668 and is currently estimated at $782,403, approximately $434 per square foot. 67 Morgan Way is a home located in Barnstable County with nearby schools including Barnstable United Elementary School, West Barnstable Elementary School, and Barnstable Intermediate School.
Ownership History
Date
Name
Owned For
Owner Type
Purchase Details
Closed on
Feb 12, 1998
Sold by
Hunter Hill 3 Dev T
Bought by
Moriarty Michael J
Current Estimated Value
Create a Home Valuation Report for This Property
The Home Valuation Report is an in-depth analysis detailing your home's value as well as a comparison with similar homes in the area
Home Values in the Area
Average Home Value in this Area
Purchase History
| Date | Buyer | Sale Price | Title Company |
|---|---|---|---|
| Moriarty Michael J | $197,000 | -- |
Source: Public Records
Mortgage History
| Date | Status | Borrower | Loan Amount |
|---|---|---|---|
| Open | Moriarty Michael J | $310,000 | |
| Closed | Moriarty Michael J | $30,000 | |
| Closed | Moriarty Michael J | $213,000 | |
| Closed | Moriarty Michael J | $35,400 |
Source: Public Records
Tax History Compared to Growth
Tax History
| Year | Tax Paid | Tax Assessment Tax Assessment Total Assessment is a certain percentage of the fair market value that is determined by local assessors to be the total taxable value of land and additions on the property. | Land | Improvement |
|---|---|---|---|---|
| 2025 | $5,878 | $629,300 | $175,100 | $454,200 |
| 2024 | $5,139 | $598,900 | $175,100 | $423,800 |
| 2023 | $4,919 | $540,000 | $173,000 | $367,000 |
| 2022 | $4,721 | $424,900 | $123,000 | $301,900 |
| 2021 | $4,697 | $400,800 | $123,000 | $277,800 |
| 2020 | $4,500 | $371,300 | $123,000 | $248,300 |
| 2019 | $4,596 | $374,300 | $123,000 | $251,300 |
| 2018 | $4,360 | $351,900 | $134,900 | $217,000 |
| 2017 | $4,231 | $345,700 | $134,900 | $210,800 |
| 2016 | $4,157 | $346,700 | $135,900 | $210,800 |
| 2015 | $4,016 | $335,800 | $131,700 | $204,100 |
Source: Public Records
Map
Nearby Homes
- 40 Appaloosa Way
- 50 Currycomb Cir
- 80 Saddler Ln
- 74 Saddler Ln
- 88 Joe Thompson Rd
- 62 3 Ponds Dr
- 62 Three Ponds Dr
- 329 Woodside Rd
- 250 The Plains Rd
- 282 Parker Rd
- 1044 Old Falmouth Rd
- 1028 Old Falmouth Rd
- 350 Plum St
- 350 & 360 Plum St
- 900 Old Stage Rd
- 87 Foxglove Rd
- 9 Locust Ave
- 66 Tern Ln
- 73 Tern Ln
- 1825 Main St