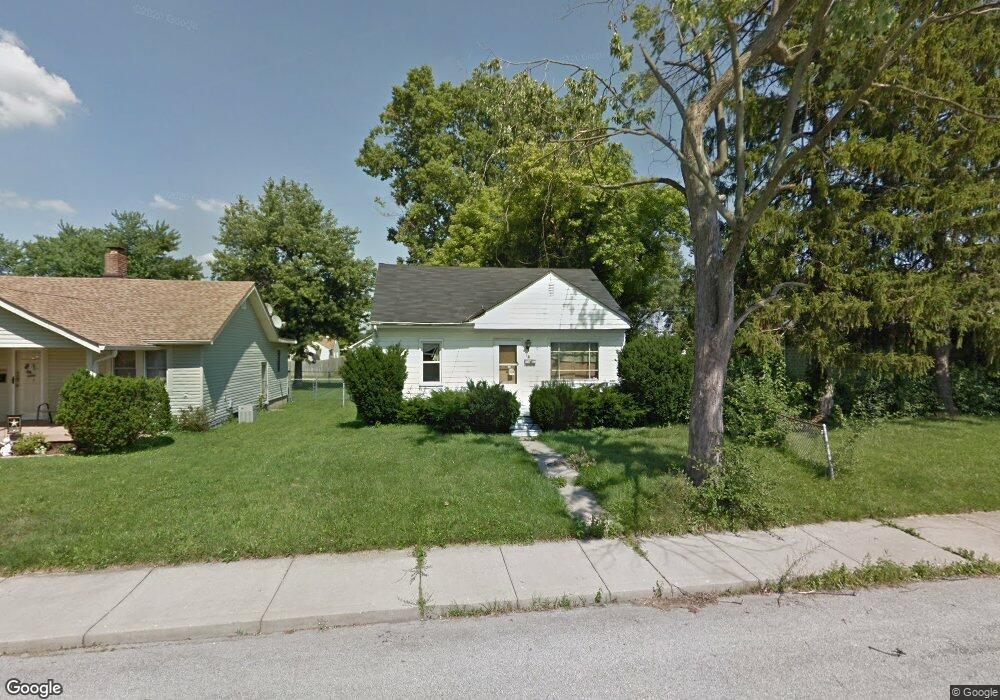
67 N 3rd Ave Beech Grove, IN 46107
Estimated Value: $147,000 - $158,000
3
Beds
1
Bath
800
Sq Ft
$190/Sq Ft
Est. Value
About This Home
This home is located at 67 N 3rd Ave, Beech Grove, IN 46107 and is currently estimated at $152,006, approximately $190 per square foot. 67 N 3rd Ave is a home located in Marion County with nearby schools including Hornet Park Elementary School, Central Elementary School, and South Grove Intermediate School.
Ownership History
Date
Name
Owned For
Owner Type
Purchase Details
Closed on
Sep 30, 2011
Sold by
Federal National Mortgage Association
Bought by
Mark Wilson Property Group Llc
Current Estimated Value
Purchase Details
Closed on
Aug 2, 2011
Sold by
Bennett Jennifer C
Bought by
Federal National Mortgage Association and Fannie Mae
Purchase Details
Closed on
Mar 10, 2005
Sold by
Secretary Of Veterans Affairs
Bought by
Bennett Jennifer C
Home Financials for this Owner
Home Financials are based on the most recent Mortgage that was taken out on this home.
Original Mortgage
$66,800
Interest Rate
5.88%
Mortgage Type
New Conventional
Create a Home Valuation Report for This Property
The Home Valuation Report is an in-depth analysis detailing your home's value as well as a comparison with similar homes in the area
Home Values in the Area
Average Home Value in this Area
Purchase History
| Date | Buyer | Sale Price | Title Company |
|---|---|---|---|
| Mark Wilson Property Group Llc | $23,700 | None Available | |
| Federal National Mortgage Association | $69,177 | None Available | |
| Bennett Jennifer C | -- | None Available |
Source: Public Records
Mortgage History
| Date | Status | Borrower | Loan Amount |
|---|---|---|---|
| Previous Owner | Bennett Jennifer C | $66,800 |
Source: Public Records
Tax History
| Year | Tax Paid | Tax Assessment Tax Assessment Total Assessment is a certain percentage of the fair market value that is determined by local assessors to be the total taxable value of land and additions on the property. | Land | Improvement |
|---|---|---|---|---|
| 2024 | $2,722 | $97,600 | $17,000 | $80,600 |
| 2023 | $2,722 | $97,600 | $17,000 | $80,600 |
| 2022 | $2,517 | $88,000 | $17,000 | $71,000 |
| 2021 | $2,085 | $75,300 | $17,000 | $58,300 |
| 2020 | $1,869 | $71,800 | $17,000 | $54,800 |
| 2019 | $1,495 | $59,600 | $7,000 | $52,600 |
| 2018 | $1,344 | $55,500 | $7,000 | $48,500 |
| 2017 | $1,414 | $56,500 | $7,000 | $49,500 |
| 2016 | $1,162 | $46,900 | $7,000 | $39,900 |
| 2014 | $1,135 | $48,300 | $7,000 | $41,300 |
| 2013 | $525 | $48,300 | $7,000 | $41,300 |
Source: Public Records
Map
Nearby Homes
Your Personal Tour Guide
Ask me questions while you tour the home.