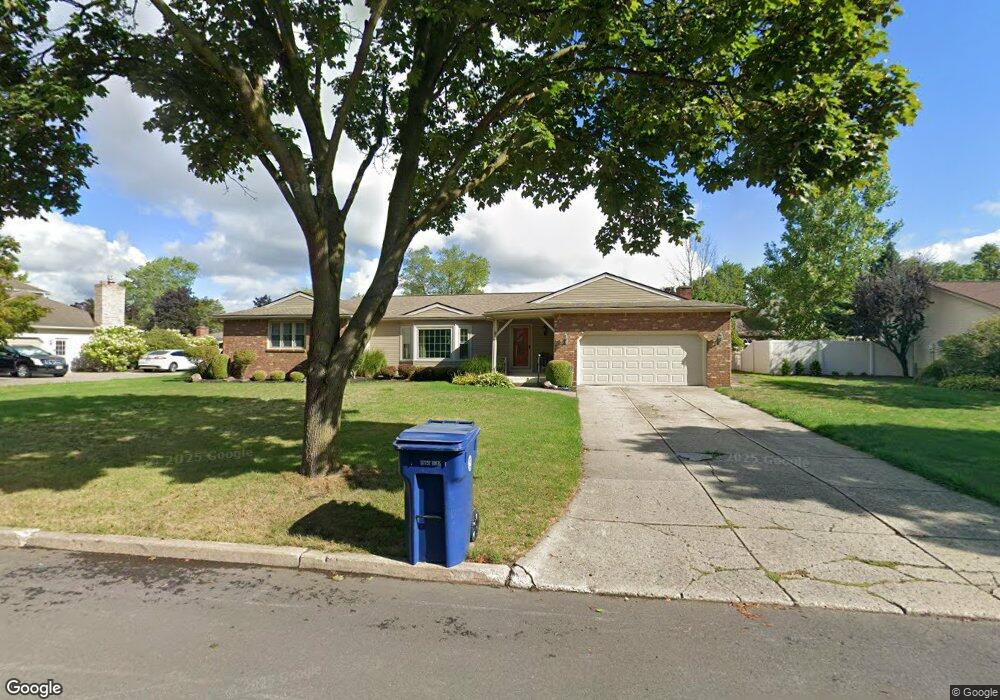
67 Obrien Dr Lockport, NY 14094
Estimated Value: $307,000 - $344,000
3
Beds
2
Baths
1,791
Sq Ft
$183/Sq Ft
Est. Value
About This Home
This home is located at 67 Obrien Dr, Lockport, NY 14094 and is currently estimated at $327,168, approximately $182 per square foot. 67 Obrien Dr is a home located in Niagara County with nearby schools including Aaron Mossell Junior High School, Lockport High School, and DeSales Catholic School.
Ownership History
Date
Name
Owned For
Owner Type
Purchase Details
Closed on
Nov 5, 2009
Sold by
Smith, Life Use Ethel
Bought by
Starks Calvin
Current Estimated Value
Home Financials for this Owner
Home Financials are based on the most recent Mortgage that was taken out on this home.
Original Mortgage
$100,000
Outstanding Balance
$65,496
Interest Rate
5.06%
Mortgage Type
New Conventional
Estimated Equity
$261,672
Purchase Details
Closed on
Nov 2, 2009
Sold by
Smith Charles W and Forsyth Denise
Bought by
Starks Calvin A and Mccoy Starks Pamela A
Home Financials for this Owner
Home Financials are based on the most recent Mortgage that was taken out on this home.
Original Mortgage
$100,000
Outstanding Balance
$65,496
Interest Rate
5.06%
Mortgage Type
New Conventional
Estimated Equity
$261,672
Purchase Details
Closed on
Apr 30, 2008
Sold by
Smith Ethel
Bought by
Smith Charles
Purchase Details
Closed on
Sep 27, 2007
Sold by
Kurbs Harry
Bought by
Smith Ethel
Create a Home Valuation Report for This Property
The Home Valuation Report is an in-depth analysis detailing your home's value as well as a comparison with similar homes in the area
Home Values in the Area
Average Home Value in this Area
Purchase History
| Date | Buyer | Sale Price | Title Company |
|---|---|---|---|
| Starks Calvin | $144,000 | Daniel Linderman | |
| Starks Calvin A | $144,000 | None Available | |
| Smith Charles | -- | Morgan Jones | |
| Smith Ethel | $145,000 | David Mansour |
Source: Public Records
Mortgage History
| Date | Status | Borrower | Loan Amount |
|---|---|---|---|
| Open | Starks Calvin A | $100,000 |
Source: Public Records
Tax History
| Year | Tax Paid | Tax Assessment Tax Assessment Total Assessment is a certain percentage of the fair market value that is determined by local assessors to be the total taxable value of land and additions on the property. | Land | Improvement |
|---|---|---|---|---|
| 2024 | $5,440 | $250,000 | $22,500 | $227,500 |
| 2023 | $5,500 | $245,000 | $22,500 | $222,500 |
| 2022 | $4,076 | $225,000 | $22,500 | $202,500 |
| 2021 | $4,440 | $150,000 | $23,500 | $126,500 |
| 2020 | $4,191 | $150,000 | $23,500 | $126,500 |
| 2019 | $2,557 | $150,000 | $23,500 | $126,500 |
| 2018 | $2,588 | $150,000 | $23,500 | $126,500 |
| 2017 | $2,557 | $150,000 | $23,500 | $126,500 |
| 2016 | $2,426 | $150,000 | $23,500 | $126,500 |
| 2015 | -- | $150,000 | $23,500 | $126,500 |
| 2014 | -- | $150,000 | $23,500 | $126,500 |
Source: Public Records
Map
Nearby Homes
- 100 Pennsylvania Ave
- VL Akron Rd Lot #3
- 50 Briarwood Dr
- 168 Continental Dr
- 92 Lindhurst Dr
- 18 Hoover Pkwy
- 76 Elizabeth Dr
- 84 Davison Ct
- 21 Eisenhower Dr
- 6502 Colonial Dr
- 1 The Common
- 69 Morrow Ave
- 65 Morrow Ave
- 91 Oliver St
- 6685 Curtis Ct
- 6683 Curtis Ct Unit 14
- 6761 E High St
- 180 Spalding St
- 165 Erie St
- 6673 Curtis Ct
Your Personal Tour Guide
Ask me questions while you tour the home.