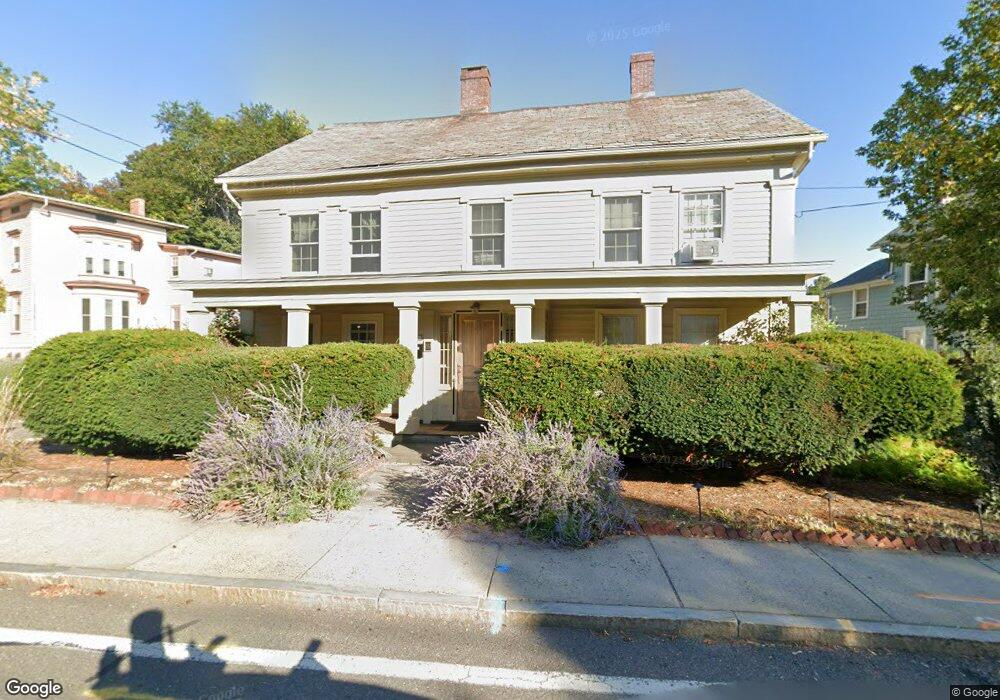
67 Old South St Northampton, MA 01060
Estimated Value: $980,000 - $1,270,000
9
Beds
2
Baths
4,096
Sq Ft
$263/Sq Ft
Est. Value
About This Home
This home is located at 67 Old South St, Northampton, MA 01060 and is currently estimated at $1,078,000, approximately $263 per square foot. 67 Old South St is a home located in Hampshire County with nearby schools including Northampton High School, Hilltown Cooperative Charter Public School, and The Montessori School of Northampton.
Ownership History
Date
Name
Owned For
Owner Type
Purchase Details
Closed on
May 20, 2008
Sold by
Hynes Elizabeth and Malloy Elizabeth
Bought by
Hynes Elizabeth
Current Estimated Value
Purchase Details
Closed on
Dec 4, 1998
Sold by
Est Andersen Howard T
Bought by
Hynes Elizabeth R and Malloy Elizabeth
Home Financials for this Owner
Home Financials are based on the most recent Mortgage that was taken out on this home.
Original Mortgage
$100,000
Interest Rate
6.68%
Mortgage Type
Purchase Money Mortgage
Create a Home Valuation Report for This Property
The Home Valuation Report is an in-depth analysis detailing your home's value as well as a comparison with similar homes in the area
Home Values in the Area
Average Home Value in this Area
Purchase History
| Date | Buyer | Sale Price | Title Company |
|---|---|---|---|
| Hynes Elizabeth | $175,000 | -- | |
| Hynes Elizabeth R | $175,000 | -- | |
| Hynes Elizabeth R | $175,000 | -- |
Source: Public Records
Mortgage History
| Date | Status | Borrower | Loan Amount |
|---|---|---|---|
| Previous Owner | Hynes Elizabeth R | $100,000 |
Source: Public Records
Tax History Compared to Growth
Tax History
| Year | Tax Paid | Tax Assessment Tax Assessment Total Assessment is a certain percentage of the fair market value that is determined by local assessors to be the total taxable value of land and additions on the property. | Land | Improvement |
|---|---|---|---|---|
| 2025 | $12,449 | $893,700 | $171,900 | $721,800 |
| 2024 | $12,457 | $820,100 | $171,900 | $648,200 |
| 2023 | $11,248 | $710,100 | $156,100 | $554,000 |
| 2022 | $9,829 | $549,400 | $146,000 | $403,400 |
| 2021 | $7,118 | $409,800 | $139,300 | $270,500 |
| 2020 | $6,885 | $409,800 | $139,300 | $270,500 |
| 2019 | $6,753 | $388,800 | $139,800 | $249,000 |
| 2018 | $6,562 | $385,100 | $139,400 | $245,700 |
| 2017 | $6,427 | $385,100 | $139,400 | $245,700 |
| 2016 | $6,223 | $385,100 | $139,400 | $245,700 |
| 2015 | $5,965 | $377,500 | $131,900 | $245,600 |
| 2014 | $5,810 | $377,500 | $131,900 | $245,600 |
Source: Public Records
Map
Nearby Homes
- 67 Old South St
- 244 Main St
- 12 School St
- 35 New South St Unit 307
- 43 Center St Unit K
- 25 Munroe St
- 57 Columbus Ave
- 86 Lyman Rd
- 107 Williams St Unit 2c
- 107 Williams St Unit 3c
- 107 Williams St Unit A1
- 107 Williams St Unit 2B
- 56 Olive St
- 10 Hawley St Unit 4C
- 10 Hawley St Unit 4D
- 10 Hawley St Unit 4B
- 10 Hawley St Unit 4A
- 30 Graves Ave Unit B
- 36 Butler Place
- 58 Phillips Place
- 69 Old St S Unit 69
- 67R Old St S Unit 67R
- 67F Old St S Unit 67F
- 67F Old St S Unit 2
- 67R Old St S Unit 3
- 69 Old St S Unit Left side
- 67 Old St S Unit 2
- 67 Old St S Unit 3
- 67 Old St S
- 61 Old South St
- 62 Old St S
- 5 Fruit St
- 3 Clark Ave
- 70 Old St S
- 3 Fruit St
- 54 Old South St
- 9 Dewey Ct
- 11 Fruit St
- 0 Conz St
- 12 Fruit St