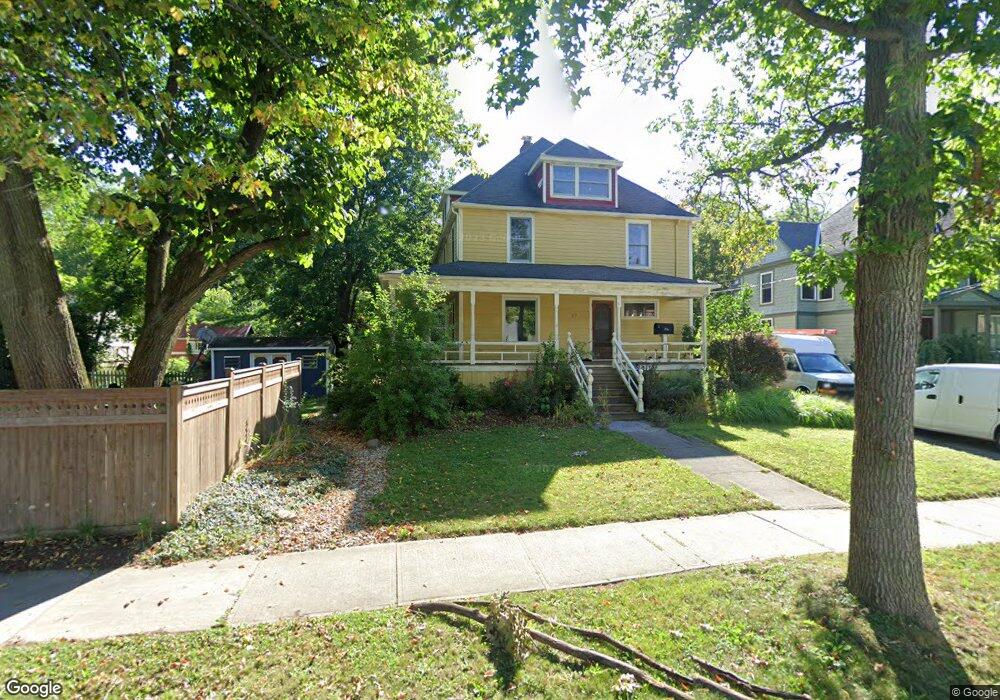
67 S Cedar St Oberlin, OH 44074
Estimated Value: $398,000 - $455,246
4
Beds
4
Baths
3,727
Sq Ft
$115/Sq Ft
Est. Value
About This Home
This home is located at 67 S Cedar St, Oberlin, OH 44074 and is currently estimated at $427,062, approximately $114 per square foot. 67 S Cedar St is a home located in Lorain County with nearby schools including Oberlin Elementary School, Prospect Elementary School, and Langston Middle School.
Ownership History
Date
Name
Owned For
Owner Type
Purchase Details
Closed on
Sep 11, 2017
Sold by
Schmidt Amanda H and Schmidt Joshua P
Bought by
Schmidt Joshua P and Schmidt Amanda H
Current Estimated Value
Purchase Details
Closed on
Jun 28, 2011
Sold by
Treuhaft Paul S
Bought by
Schmidt Amanda H
Home Financials for this Owner
Home Financials are based on the most recent Mortgage that was taken out on this home.
Original Mortgage
$252,000
Outstanding Balance
$174,347
Interest Rate
4.63%
Mortgage Type
New Conventional
Estimated Equity
$252,715
Purchase Details
Closed on
Apr 23, 2009
Sold by
Treuhaft Paul S
Bought by
Treuhaft Paul S and The Paul S Treuhaft Trust
Purchase Details
Closed on
Feb 17, 2009
Sold by
Block Beverly R
Bought by
Treuhaft Paul S
Purchase Details
Closed on
Jun 5, 2000
Sold by
Treuhaft Paul S
Bought by
Treuhaft Paul S and Block Beverly R
Create a Home Valuation Report for This Property
The Home Valuation Report is an in-depth analysis detailing your home's value as well as a comparison with similar homes in the area
Home Values in the Area
Average Home Value in this Area
Purchase History
| Date | Buyer | Sale Price | Title Company |
|---|---|---|---|
| Schmidt Joshua P | -- | -- | |
| Schmidt Amanda H | $315,000 | Lawyers Title Co | |
| Treuhaft Paul S | -- | Attorney | |
| Treuhaft Paul S | -- | Attorney | |
| Treuhaft Paul S | -- | Lorain County Title Co Inc |
Source: Public Records
Mortgage History
| Date | Status | Borrower | Loan Amount |
|---|---|---|---|
| Open | Schmidt Amanda H | $252,000 |
Source: Public Records
Tax History Compared to Growth
Tax History
| Year | Tax Paid | Tax Assessment Tax Assessment Total Assessment is a certain percentage of the fair market value that is determined by local assessors to be the total taxable value of land and additions on the property. | Land | Improvement |
|---|---|---|---|---|
| 2024 | $4,546 | $92,467 | $13,300 | $79,167 |
| 2023 | $4,957 | $90,923 | $10,539 | $80,385 |
| 2022 | $4,824 | $90,923 | $10,539 | $80,385 |
| 2021 | $4,816 | $90,923 | $10,539 | $80,385 |
| 2020 | $4,491 | $79,690 | $9,240 | $70,450 |
| 2019 | $4,443 | $79,690 | $9,240 | $70,450 |
| 2018 | $4,475 | $79,690 | $9,240 | $70,450 |
| 2017 | $4,232 | $76,900 | $6,270 | $70,630 |
| 2016 | $4,274 | $76,900 | $6,270 | $70,630 |
| 2015 | $4,279 | $76,900 | $6,270 | $70,630 |
| 2014 | $4,138 | $72,550 | $5,910 | $66,640 |
| 2013 | $4,067 | $72,550 | $5,910 | $66,640 |
Source: Public Records
Map
Nearby Homes
- 190 Elm St
- 215 W College St
- 252 W College St
- 149 Morgan St
- 147 Morgan St
- 81 S Professor St
- 89 S Professor St
- 121 S Professor St
- 123 S Professor St
- 83 S Pleasant St
- 18 Edison St
- 461 W Lorain St
- 118 Locust St
- 216 N Main St
- 296 S Pleasant St
- 230 N Main St
- 345 N Professor St
- 182 E Hamilton St
- 110 Shipherd Cir
- 95 Shipherd Cir