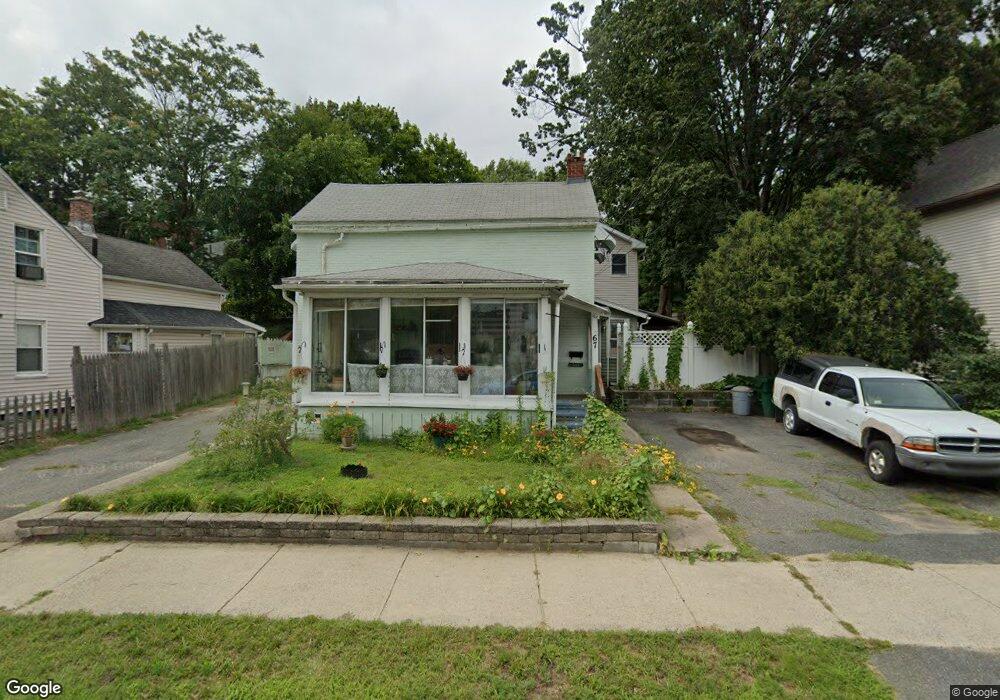
67 Sheridan St Chicopee, MA 01020
Chicopee Falls NeighborhoodEstimated Value: $328,000 - $380,000
4
Beds
2
Baths
2,114
Sq Ft
$168/Sq Ft
Est. Value
About This Home
This home is located at 67 Sheridan St, Chicopee, MA 01020 and is currently estimated at $355,456, approximately $168 per square foot. 67 Sheridan St is a home located in Hampden County with nearby schools including Barry Elementary School, Bellamy Middle School, and Chicopee Comprehensive High School.
Ownership History
Date
Name
Owned For
Owner Type
Purchase Details
Closed on
Jan 13, 2017
Sold by
Jamroz Viva L
Bought by
Jamroz John W
Current Estimated Value
Purchase Details
Closed on
Feb 26, 2003
Sold by
Jamroz Viva I and Jamroz Viva L
Bought by
Jamroz John W and Jamroz Viva I
Purchase Details
Closed on
Nov 10, 1976
Bought by
Jamroz Viva I and Jamroz John W
Create a Home Valuation Report for This Property
The Home Valuation Report is an in-depth analysis detailing your home's value as well as a comparison with similar homes in the area
Home Values in the Area
Average Home Value in this Area
Purchase History
| Date | Buyer | Sale Price | Title Company |
|---|---|---|---|
| Jamroz John W | -- | -- | |
| Jamroz John W | -- | -- | |
| Jamroz Viva I | -- | -- |
Source: Public Records
Tax History Compared to Growth
Tax History
| Year | Tax Paid | Tax Assessment Tax Assessment Total Assessment is a certain percentage of the fair market value that is determined by local assessors to be the total taxable value of land and additions on the property. | Land | Improvement |
|---|---|---|---|---|
| 2025 | $3,939 | $259,800 | $93,700 | $166,100 |
| 2024 | $3,734 | $253,000 | $91,900 | $161,100 |
| 2023 | $3,501 | $231,100 | $83,600 | $147,500 |
| 2022 | $3,340 | $196,600 | $72,700 | $123,900 |
| 2021 | $3,085 | $175,200 | $62,400 | $112,800 |
| 2020 | $2,947 | $168,800 | $62,400 | $106,400 |
| 2019 | $2,897 | $161,300 | $62,400 | $98,900 |
| 2018 | $2,807 | $153,300 | $59,400 | $93,900 |
| 2017 | $2,645 | $152,800 | $52,300 | $100,500 |
| 2016 | $2,587 | $153,000 | $52,300 | $100,700 |
| 2015 | $2,684 | $153,000 | $52,300 | $100,700 |
| 2014 | $1,254 | $153,000 | $52,300 | $100,700 |
Source: Public Records
Map
Nearby Homes