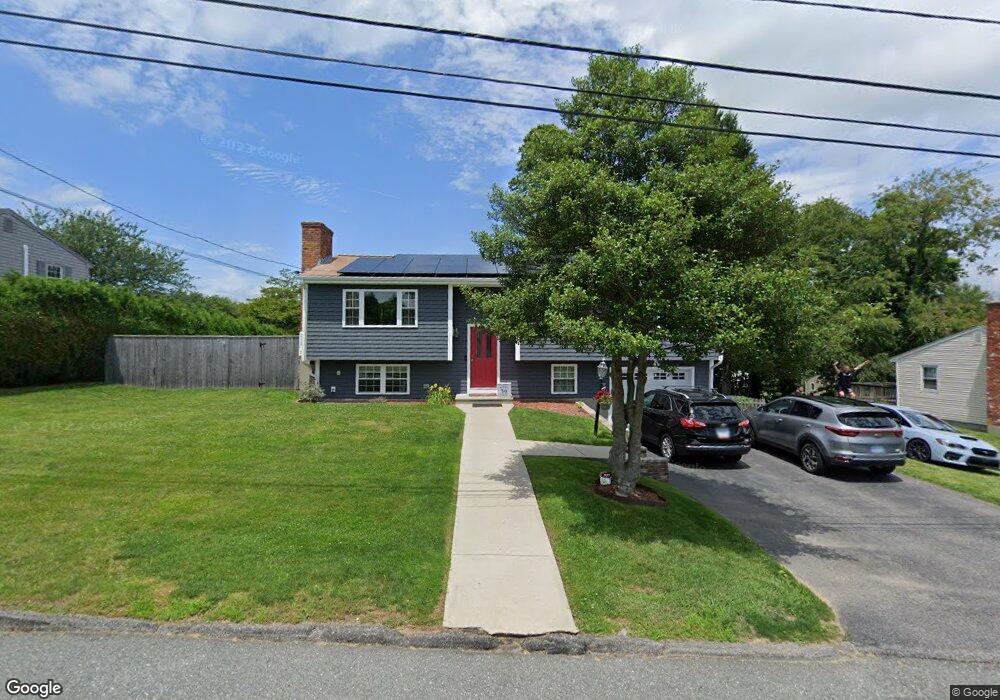
67 Sowams Dr Bristol, RI 02809
The Narrows NeighborhoodEstimated Value: $460,848 - $541,000
3
Beds
1
Bath
1,644
Sq Ft
$308/Sq Ft
Est. Value
About This Home
This home is located at 67 Sowams Dr, Bristol, RI 02809 and is currently estimated at $505,712, approximately $307 per square foot. 67 Sowams Dr is a home located in Bristol County with nearby schools including Mt. Hope High School, Our Lady of Mt. Carmel School, and East Bay Career Academy.
Ownership History
Date
Name
Owned For
Owner Type
Purchase Details
Closed on
Jan 8, 2008
Sold by
Deutsche Bank Natl T C
Bought by
Mancieri Jodi and Mancieri Brian
Current Estimated Value
Home Financials for this Owner
Home Financials are based on the most recent Mortgage that was taken out on this home.
Original Mortgage
$245,000
Interest Rate
6.27%
Mortgage Type
Purchase Money Mortgage
Purchase Details
Closed on
Jul 24, 2007
Sold by
Esposito Steven B
Bought by
Deutsche Bank Natl T C
Purchase Details
Closed on
Jan 30, 2006
Sold by
Conti Darlene M
Bought by
Esposito Steven B
Home Financials for this Owner
Home Financials are based on the most recent Mortgage that was taken out on this home.
Original Mortgage
$256,000
Interest Rate
6.34%
Mortgage Type
Purchase Money Mortgage
Create a Home Valuation Report for This Property
The Home Valuation Report is an in-depth analysis detailing your home's value as well as a comparison with similar homes in the area
Home Values in the Area
Average Home Value in this Area
Purchase History
| Date | Buyer | Sale Price | Title Company |
|---|---|---|---|
| Mancieri Jodi | $250,000 | -- | |
| Deutsche Bank Natl T C | $266,500 | -- | |
| Esposito Steven B | $320,000 | -- |
Source: Public Records
Mortgage History
| Date | Status | Borrower | Loan Amount |
|---|---|---|---|
| Open | Esposito Steven B | $242,166 | |
| Closed | Esposito Steven B | $245,000 | |
| Previous Owner | Esposito Steven B | $256,000 |
Source: Public Records
Tax History Compared to Growth
Tax History
| Year | Tax Paid | Tax Assessment Tax Assessment Total Assessment is a certain percentage of the fair market value that is determined by local assessors to be the total taxable value of land and additions on the property. | Land | Improvement |
|---|---|---|---|---|
| 2025 | $4,337 | $313,800 | $145,500 | $168,300 |
| 2024 | $4,337 | $313,800 | $145,500 | $168,300 |
| 2023 | $4,192 | $313,800 | $145,500 | $168,300 |
| 2022 | $4,079 | $313,800 | $145,500 | $168,300 |
| 2021 | $3,855 | $268,100 | $134,000 | $134,100 |
| 2020 | $3,772 | $268,100 | $134,000 | $134,100 |
| 2019 | $3,678 | $268,100 | $134,000 | $134,100 |
| 2018 | $3,863 | $251,200 | $127,900 | $123,300 |
| 2017 | $3,288 | $220,400 | $110,900 | $109,500 |
| 2016 | $3,255 | $220,400 | $110,900 | $109,500 |
| 2015 | $3,092 | $220,400 | $110,900 | $109,500 |
| 2014 | $3,064 | $234,640 | $125,200 | $109,440 |
Source: Public Records
Map
Nearby Homes