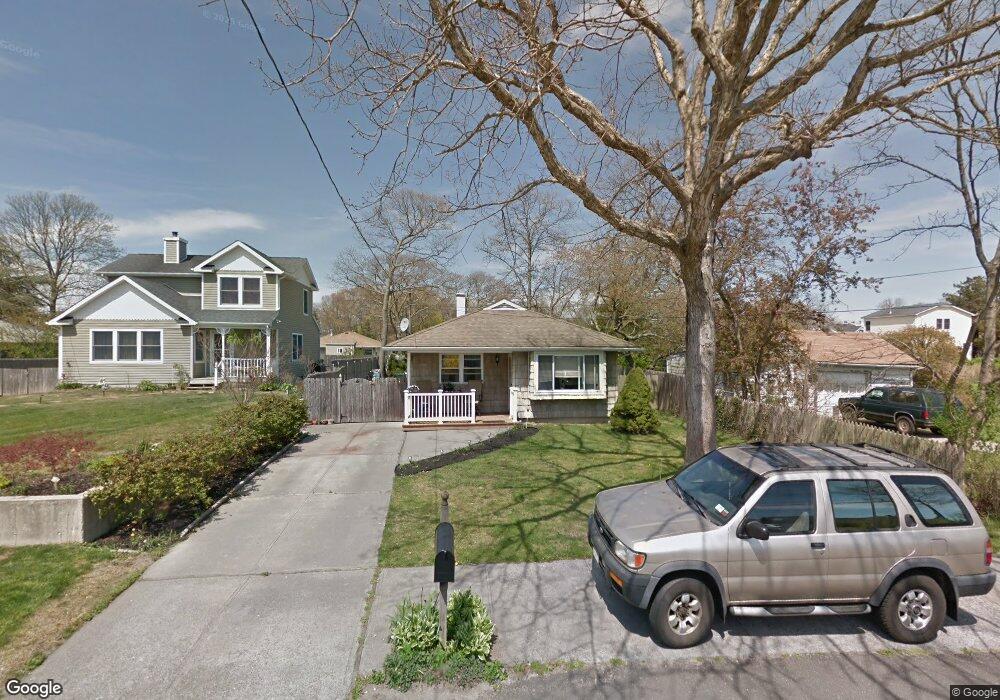
67 Trafalgar Dr Shirley, NY 11967
Estimated Value: $352,000 - $418,681
3
Beds
1
Bath
1,008
Sq Ft
$392/Sq Ft
Est. Value
About This Home
This home is located at 67 Trafalgar Dr, Shirley, NY 11967 and is currently estimated at $394,670, approximately $391 per square foot. 67 Trafalgar Dr is a home located in Suffolk County with nearby schools including John S. Hobart Elementary School, William Paca Middle School, and William Floyd High School.
Ownership History
Date
Name
Owned For
Owner Type
Purchase Details
Closed on
Jul 23, 2007
Sold by
All Island Purchase Corp
Bought by
Taiclet Lisa
Current Estimated Value
Purchase Details
Closed on
Jan 31, 2007
Sold by
Muniz Sammy
Bought by
All Island Purchase Corp
Purchase Details
Closed on
Oct 2, 2002
Sold by
Mitchner Lolita
Bought by
Muniz Sammy
Home Financials for this Owner
Home Financials are based on the most recent Mortgage that was taken out on this home.
Original Mortgage
$110,000
Interest Rate
6.03%
Purchase Details
Closed on
Feb 12, 2002
Sold by
Barr William C and Barr Jeannine A
Bought by
Mitchner Lolita
Home Financials for this Owner
Home Financials are based on the most recent Mortgage that was taken out on this home.
Original Mortgage
$116,450
Interest Rate
7.01%
Purchase Details
Closed on
May 1, 1996
Sold by
Kennedy Margaret and Skuthan Charles
Bought by
Barr William C and Barr Jeannine A
Create a Home Valuation Report for This Property
The Home Valuation Report is an in-depth analysis detailing your home's value as well as a comparison with similar homes in the area
Home Values in the Area
Average Home Value in this Area
Purchase History
| Date | Buyer | Sale Price | Title Company |
|---|---|---|---|
| Taiclet Lisa | $225,000 | Ronald Farr | |
| All Island Purchase Corp | $162,500 | Mitch Ferraro | |
| Muniz Sammy | $145,400 | Fidelity National Title Ins | |
| Mitchner Lolita | $122,600 | United General Title Ins Co | |
| Barr William C | $40,000 | First American Title Ins Co |
Source: Public Records
Mortgage History
| Date | Status | Borrower | Loan Amount |
|---|---|---|---|
| Previous Owner | Muniz Sammy | $110,000 | |
| Previous Owner | Mitchner Lolita | $116,450 |
Source: Public Records
Tax History Compared to Growth
Tax History
| Year | Tax Paid | Tax Assessment Tax Assessment Total Assessment is a certain percentage of the fair market value that is determined by local assessors to be the total taxable value of land and additions on the property. | Land | Improvement |
|---|---|---|---|---|
| 2024 | $5,119 | $1,425 | $150 | $1,275 |
| 2023 | $5,119 | $1,425 | $150 | $1,275 |
| 2022 | $5,226 | $1,425 | $150 | $1,275 |
| 2021 | $5,226 | $1,425 | $150 | $1,275 |
| 2020 | $5,387 | $1,425 | $150 | $1,275 |
| 2019 | $5,387 | $0 | $0 | $0 |
| 2018 | $5,096 | $1,425 | $150 | $1,275 |
| 2017 | $5,076 | $1,425 | $150 | $1,275 |
| 2016 | $5,070 | $1,425 | $150 | $1,275 |
| 2015 | -- | $1,425 | $150 | $1,275 |
| 2014 | -- | $1,625 | $150 | $1,475 |
Source: Public Records
Map
Nearby Homes
- 67 Lombardy Dr
- 70 Trafalgar Dr
- 73 Saint George Dr
- 97 Lombardy Dr
- 46 Saint George Dr
- 40 Saint George Dr
- 29 Seymour Dr
- 89 Manor Dr
- 14 Heathcote Ct
- 89 Argyle Dr
- 7 Fairlawn Ct
- 119 Rugby Dr E
- 0 Grandview Dr Unit ONE3575085
- 32 Pine Tree Dr
- 32 Pinetree Dr
- 0 Abby Ln
- 82 Grandview Dr
- 72 Grandview Dr
- 17 Pinetree Dr
- 181 William Floyd Pkwy
- 65 Trafalgar Dr
- 63 Trafalgar Dr
- 71 Trafalgar Dr
- 66 Saint George Dr
- 72 Saint George Dr
- 62 Saint George Dr
- 66 Trafalgar Dr
- 64 Trafalgar Dr
- 74 Saint George Dr
- 74 Saint George Dr
- 62 Trafalgar Dr
- 62 Trafalga
- New Construction St George Dr
- 62 Trafalgar Dr
- 69 Pinetree Dr
- 75 Trafalgar Dr
- 76 Saint George Dr
- 60 Trafalgar Dr
- 69 Pine Tree Dr
- 74 Trafalgar Dr