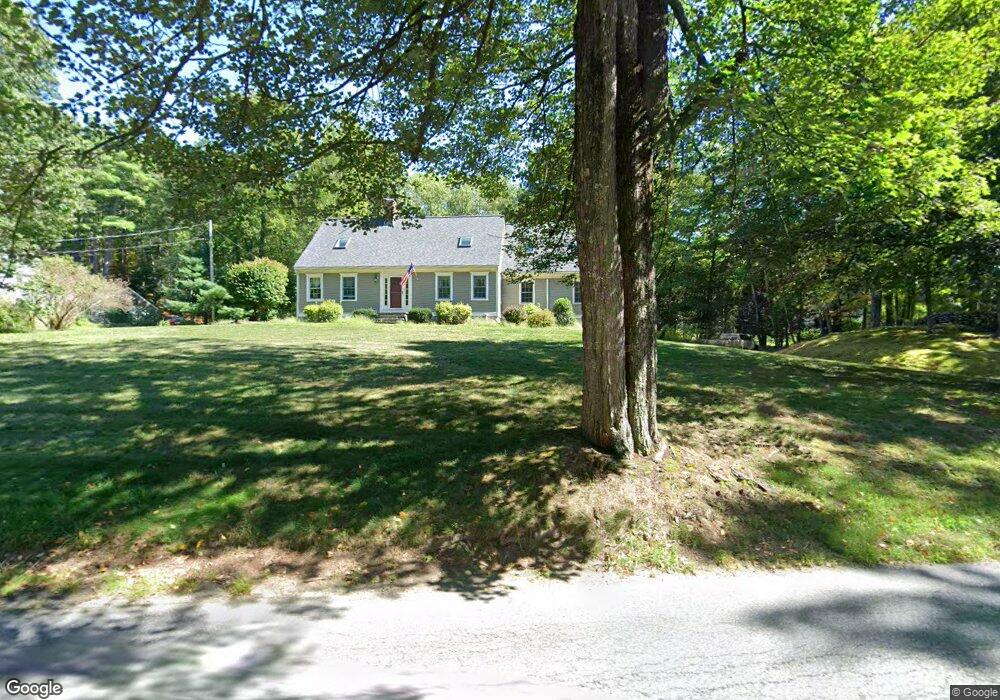
67 West St Pepperell, MA 01463
Estimated Value: $643,000 - $697,000
3
Beds
2
Baths
3,038
Sq Ft
$218/Sq Ft
Est. Value
About This Home
This home is located at 67 West St, Pepperell, MA 01463 and is currently estimated at $661,652, approximately $217 per square foot. 67 West St is a home located in Middlesex County with nearby schools including North Middlesex Regional High School and Pepperell Christian Academy.
Ownership History
Date
Name
Owned For
Owner Type
Purchase Details
Closed on
Oct 5, 2023
Sold by
Gustafson Kirk E and Gustafson Sherrie M
Bought by
Kirk & S Gustafson Ret and Gustafson
Current Estimated Value
Purchase Details
Closed on
Apr 24, 1984
Bought by
Gustafson Kirk E and Gustafson Sherrie M
Create a Home Valuation Report for This Property
The Home Valuation Report is an in-depth analysis detailing your home's value as well as a comparison with similar homes in the area
Home Values in the Area
Average Home Value in this Area
Purchase History
| Date | Buyer | Sale Price | Title Company |
|---|---|---|---|
| Kirk & S Gustafson Ret | -- | None Available | |
| Gustafson Kirk E | -- | -- |
Source: Public Records
Mortgage History
| Date | Status | Borrower | Loan Amount |
|---|---|---|---|
| Previous Owner | Gustafson Kirk E | $260,000 | |
| Previous Owner | Gustafson Kirk E | $155,000 | |
| Previous Owner | Gustafson Kirk E | $123,400 | |
| Previous Owner | Gustafson Kirk E | $68,000 |
Source: Public Records
Tax History Compared to Growth
Tax History
| Year | Tax Paid | Tax Assessment Tax Assessment Total Assessment is a certain percentage of the fair market value that is determined by local assessors to be the total taxable value of land and additions on the property. | Land | Improvement |
|---|---|---|---|---|
| 2025 | $7,976 | $545,200 | $168,100 | $377,100 |
| 2024 | $7,539 | $525,400 | $152,100 | $373,300 |
| 2023 | $7,214 | $476,500 | $128,100 | $348,400 |
| 2022 | $7,544 | $439,900 | $128,100 | $311,800 |
| 2021 | $7,526 | $420,000 | $112,100 | $307,900 |
| 2020 | $7,222 | $425,300 | $112,100 | $313,200 |
| 2019 | $6,291 | $379,200 | $112,100 | $267,100 |
| 2018 | $5,953 | $363,200 | $112,100 | $251,100 |
| 2017 | $5,636 | $354,700 | $112,100 | $242,600 |
| 2016 | $5,341 | $323,100 | $112,100 | $211,000 |
| 2015 | $5,203 | $326,200 | $112,100 | $214,100 |
| 2014 | $5,086 | $320,700 | $112,100 | $208,600 |
Source: Public Records
Map
Nearby Homes
- 41 West St
- 105 West St
- 110 Haynes Rd
- 10 Hillside St
- 18 Maple St Unit 30
- 181A South Rd
- 120 Townsend St Unit 1
- 21 Cranberry St
- 10 Lakin St
- 22 Lakin St
- 31 South St
- 18 Crosswinds Dr
- 10 Boynton St
- 31 Heald St
- 6 Mason St Unit 31
- 4 Celestial Way
- 91 Highland St
- 49 Magnolia Ln Unit 49
- 28 Beech St
- 18 Beech St