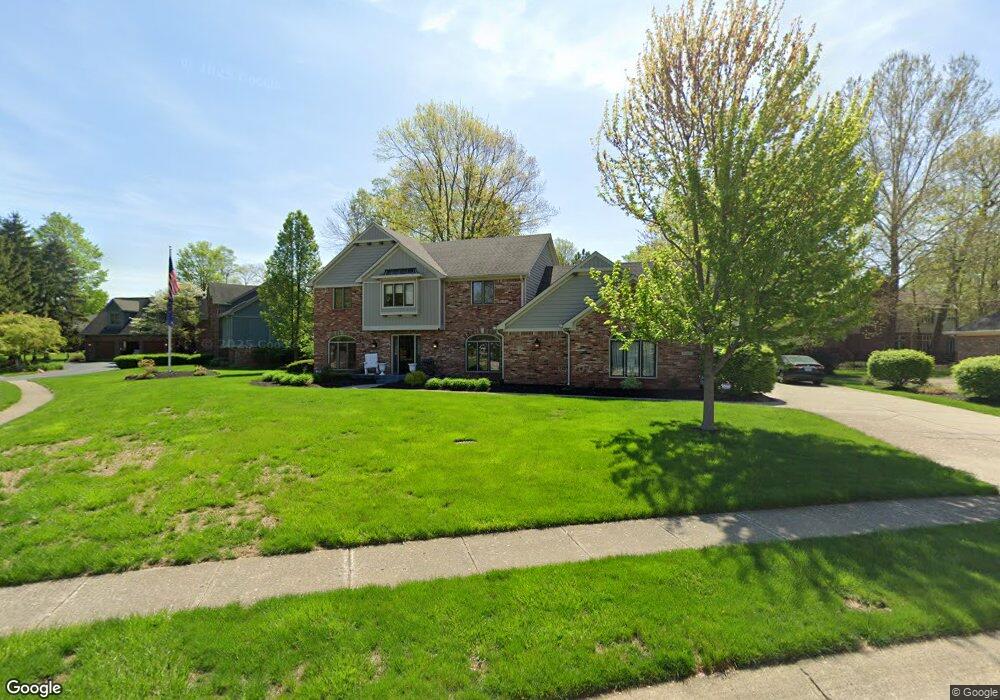
6703 Forrest Commons Blvd Indianapolis, IN 46227
Linden Wood NeighborhoodEstimated Value: $522,000 - $670,000
5
Beds
4
Baths
4,204
Sq Ft
$134/Sq Ft
Est. Value
About This Home
This home is located at 6703 Forrest Commons Blvd, Indianapolis, IN 46227 and is currently estimated at $561,493, approximately $133 per square foot. 6703 Forrest Commons Blvd is a home located in Marion County with nearby schools including William Henry Burkhart Elementary School, Perry Meridian 6th Grade Academy, and Perry Meridian Middle School.
Ownership History
Date
Name
Owned For
Owner Type
Purchase Details
Closed on
Jul 7, 2017
Sold by
Barrett Thomas R
Bought by
Sheridan Erin
Current Estimated Value
Home Financials for this Owner
Home Financials are based on the most recent Mortgage that was taken out on this home.
Original Mortgage
$244,000
Outstanding Balance
$203,001
Interest Rate
3.94%
Mortgage Type
New Conventional
Estimated Equity
$358,492
Purchase Details
Closed on
May 18, 2007
Sold by
Schnelder Micael P and Schnelder Sherry L
Bought by
Barett Thomas R and Barett Tina M
Home Financials for this Owner
Home Financials are based on the most recent Mortgage that was taken out on this home.
Original Mortgage
$49,450
Interest Rate
6.22%
Mortgage Type
Stand Alone Second
Create a Home Valuation Report for This Property
The Home Valuation Report is an in-depth analysis detailing your home's value as well as a comparison with similar homes in the area
Home Values in the Area
Average Home Value in this Area
Purchase History
| Date | Buyer | Sale Price | Title Company |
|---|---|---|---|
| Sheridan Erin | $305,000 | -- | |
| Sheridan Erin | -- | -- | |
| Barett Thomas R | -- | Chicago Title Ins Co |
Source: Public Records
Mortgage History
| Date | Status | Borrower | Loan Amount |
|---|---|---|---|
| Open | Sheridan Erin | $244,000 | |
| Previous Owner | Barett Thomas R | $49,450 | |
| Previous Owner | Barett Thomas R | $264,000 |
Source: Public Records
Tax History Compared to Growth
Tax History
| Year | Tax Paid | Tax Assessment Tax Assessment Total Assessment is a certain percentage of the fair market value that is determined by local assessors to be the total taxable value of land and additions on the property. | Land | Improvement |
|---|---|---|---|---|
| 2024 | $6,422 | $479,200 | $65,100 | $414,100 |
| 2023 | $6,422 | $486,800 | $65,100 | $421,700 |
| 2022 | $5,958 | $441,600 | $65,100 | $376,500 |
| 2021 | $5,619 | $410,500 | $65,100 | $345,400 |
| 2020 | $4,688 | $341,400 | $65,100 | $276,300 |
| 2019 | $4,665 | $337,800 | $56,600 | $281,200 |
| 2018 | $4,283 | $314,200 | $56,600 | $257,600 |
| 2017 | $4,180 | $306,500 | $56,600 | $249,900 |
| 2016 | $3,957 | $290,200 | $56,600 | $233,600 |
| 2014 | $3,769 | $308,200 | $56,600 | $251,600 |
| 2013 | $3,715 | $303,400 | $56,600 | $246,800 |
Source: Public Records
Map
Nearby Homes
- 6712 Forrest Commons Blvd
- 6725 Robin Hood Ct
- 6520 Forrest Commons Blvd
- 26 W Loretta Dr
- 6643 S New Jersey St
- 27 Forrests Edge Ct
- 20 Forrests Edge Ct
- 115 Jordan Rd
- 136 W Loretta Dr
- 410 E Southport Rd
- 232 Bangor Dr
- 128 Dahlia Ln
- 7017 Chimney Rock Ct
- 402 W Banta Rd
- 125 E Waterbury Rd
- 400 W Southport Rd
- 7011 Mclain Dr
- 42 Bennington Rd
- 931 Maynard Dr
- 6630 S Meridian St
- 6713 Forrest Commons Blvd
- 6621 Robin Hood Dr
- 6724 Robin Hood Ct
- 6615 Forrest Commons Blvd
- 6702 Forrest Commons Blvd
- 6733 Forrest Commons Blvd
- 6614 Forrest Commons Blvd
- 6612 Robin Hood Dr
- 6605 Forrest Commons Blvd
- 6705 Robin Hood Ct
- 6715 Robin Hood Ct
- 6755 Robin Hood Ct
- 6742 Forrest Commons Blvd
- 6743 Forrest Commons Blvd
- 6613 Robin Hood Dr
- 6745 Robin Hood Ct
- 6604 Forrest Commons Blvd
- 6571 Forrest Commons Blvd
- 6735 Robin Hood Ct
- 6775 Forrest Commons Blvd