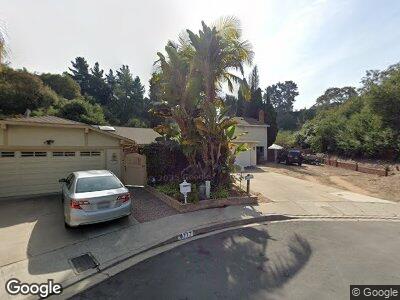
6705 Robbins Way San Diego, CA 92122
University City NeighborhoodEstimated Value: $1,509,000 - $1,622,437
3
Beds
3
Baths
1,970
Sq Ft
$798/Sq Ft
Est. Value
About This Home
This home is located at 6705 Robbins Way, San Diego, CA 92122 and is currently estimated at $1,571,609, approximately $797 per square foot. 6705 Robbins Way is a home located in San Diego County with nearby schools including Marie Curie Elementary School, Standley Middle School, and University City High School.
Ownership History
Date
Name
Owned For
Owner Type
Purchase Details
Closed on
Jan 23, 2007
Sold by
Gross Desind Deborah Anne
Bought by
Desind Neal and Gross Desind Deborah Anne
Current Estimated Value
Home Financials for this Owner
Home Financials are based on the most recent Mortgage that was taken out on this home.
Original Mortgage
$650,000
Interest Rate
5.87%
Mortgage Type
Unknown
Purchase Details
Closed on
Aug 25, 2006
Sold by
Desind Neal and Gross Desind Deborah Anne
Bought by
Gross Desind Deborah Anne
Home Financials for this Owner
Home Financials are based on the most recent Mortgage that was taken out on this home.
Original Mortgage
$650,000
Interest Rate
6.37%
Mortgage Type
Unknown
Purchase Details
Closed on
Dec 28, 1984
Bought by
Ownership Name Information
Create a Home Valuation Report for This Property
The Home Valuation Report is an in-depth analysis detailing your home's value as well as a comparison with similar homes in the area
Home Values in the Area
Average Home Value in this Area
Purchase History
| Date | Buyer | Sale Price | Title Company |
|---|---|---|---|
| Desind Neal | -- | None Available | |
| Gross Desind Deborah Anne | -- | North American Title | |
| -- | $169,500 | -- |
Source: Public Records
Mortgage History
| Date | Status | Borrower | Loan Amount |
|---|---|---|---|
| Open | Dee And Neal Desind Family Tru | $487,115 | |
| Closed | Gross Desino Deborah Anne | $650,000 | |
| Closed | Gross Desind Deborah Anne | $650,000 | |
| Closed | Desind Neal | $124,000 | |
| Closed | Desind Neal | $475,000 | |
| Closed | Desind Neal | $250,000 | |
| Closed | Desind Neal | $100,000 | |
| Closed | Desind Neal | $268,000 | |
| Closed | Desind Neal | $187,500 |
Source: Public Records
Tax History Compared to Growth
Tax History
| Year | Tax Paid | Tax Assessment Tax Assessment Total Assessment is a certain percentage of the fair market value that is determined by local assessors to be the total taxable value of land and additions on the property. | Land | Improvement |
|---|---|---|---|---|
| 2024 | $4,365 | $358,449 | $132,717 | $225,732 |
| 2023 | $4,267 | $351,421 | $130,115 | $221,306 |
| 2022 | $4,152 | $344,531 | $127,564 | $216,967 |
| 2021 | $4,122 | $337,776 | $125,063 | $212,713 |
| 2020 | $4,072 | $334,313 | $123,781 | $210,532 |
| 2019 | $3,998 | $327,758 | $121,354 | $206,404 |
| 2018 | $3,738 | $321,332 | $118,975 | $202,357 |
| 2017 | $81 | $315,033 | $116,643 | $198,390 |
| 2016 | $3,588 | $308,856 | $114,356 | $194,500 |
| 2015 | $3,534 | $304,218 | $112,639 | $191,579 |
| 2014 | $3,478 | $298,260 | $110,433 | $187,827 |
Source: Public Records
Map
Nearby Homes
- 4555 Robbins St
- 6737 Lipmann St
- 6809 Lipmann St
- 4512 Pavlov Ave
- 6174 Agee St Unit 79
- 4282 Robbins St
- 4755 Cather Ave
- 6188 Agee St Unit 230
- 5852 Dirac St
- 6172 Tamilynn St
- 4460 Huggins St
- 6330 Genesee Ave Unit 103
- 6330 Genesee Ave Unit 303
- 6330 Genesee Ave Unit 119
- 6524 Calgary Ct
- 4328 Huggins St
- 5889 Cozzens St
- 6218 Caminito Araya
- 5835 Cozzens St
- 7120 Shoreline Dr Unit 2208
- 6705 Robbins Way
- 6717 Robbins Way
- 6735 Robbins Way
- 6755 Robbins Way
- 6767 Robbins Way
- 4436 Camrose Ave
- 4296 Farley Ct
- 4444 Camrose Ave
- 6730 Robbins Way
- 4428 Camrose Ave
- 4295 Farley Ct
- 4420 Camrose Ave
- 6783 Robbins Way
- 4289 Farley Ln
- 4412 Camrose Ave
- 4286 Farley Ct
- 6760 Robbins Way
- 4297 Farley Ln
- 4281 Farley Ln
- 4346 Benhurst Ave