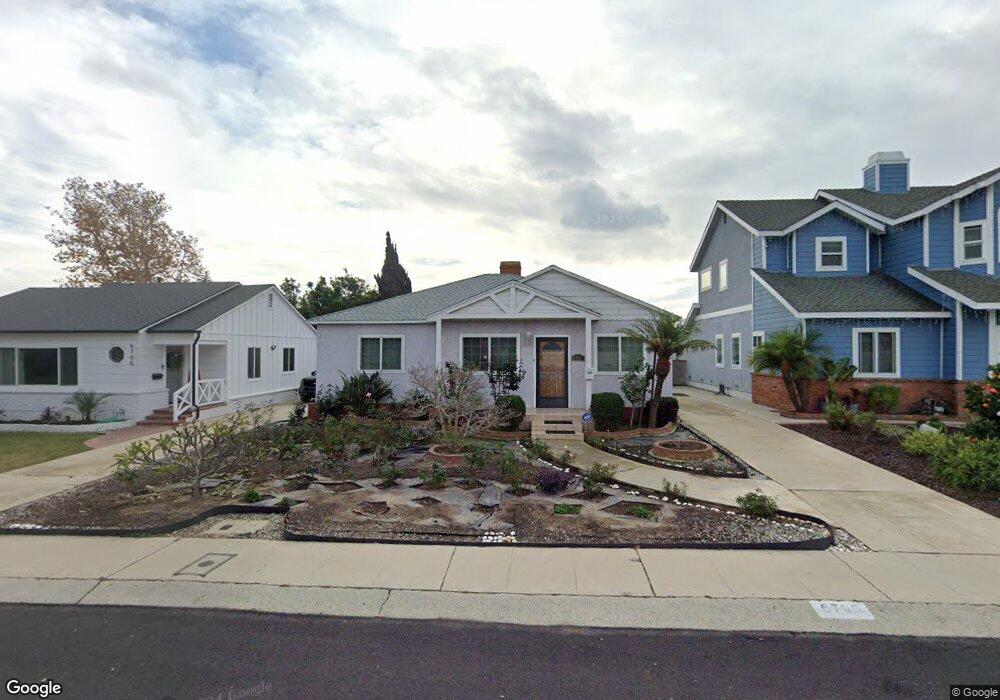
6706 W 85th Place Los Angeles, CA 90045
Westchester NeighborhoodEstimated Value: $1,449,905 - $1,745,000
2
Beds
2
Baths
1,648
Sq Ft
$967/Sq Ft
Est. Value
About This Home
This home is located at 6706 W 85th Place, Los Angeles, CA 90045 and is currently estimated at $1,593,226, approximately $966 per square foot. 6706 W 85th Place is a home located in Los Angeles County with nearby schools including Kentwood Elementary, Wright Middle School STEAM Magnet, and Westchester Enriched Sciences Magnets.
Ownership History
Date
Name
Owned For
Owner Type
Purchase Details
Closed on
Jul 6, 2020
Sold by
Chen Mei Lin
Bought by
Mei Lin Chen Family Trust and Chen
Current Estimated Value
Purchase Details
Closed on
Mar 14, 2002
Sold by
Chen Mei Lin
Bought by
Chen Mei Lin
Home Financials for this Owner
Home Financials are based on the most recent Mortgage that was taken out on this home.
Original Mortgage
$173,000
Interest Rate
6.85%
Purchase Details
Closed on
Jul 13, 1993
Sold by
Hung Hui Li
Bought by
Chen Mei Lin
Home Financials for this Owner
Home Financials are based on the most recent Mortgage that was taken out on this home.
Original Mortgage
$203,000
Interest Rate
6.94%
Purchase Details
Closed on
Jul 8, 1993
Sold by
Yi Chang Suk
Bought by
Chen Mei Lin
Home Financials for this Owner
Home Financials are based on the most recent Mortgage that was taken out on this home.
Original Mortgage
$203,000
Interest Rate
6.94%
Create a Home Valuation Report for This Property
The Home Valuation Report is an in-depth analysis detailing your home's value as well as a comparison with similar homes in the area
Home Values in the Area
Average Home Value in this Area
Purchase History
| Date | Buyer | Sale Price | Title Company |
|---|---|---|---|
| Mei Lin Chen Family Trust | -- | None Listed On Document | |
| Chen Mei Lin | -- | Stewart Title | |
| Chen Mei Lin | -- | Gateway Title Company | |
| Chen Mei Lin | $290,000 | Gateway Title Company |
Source: Public Records
Mortgage History
| Date | Status | Borrower | Loan Amount |
|---|---|---|---|
| Previous Owner | Chen Mei Lin | $173,000 | |
| Previous Owner | Chen Mei Lin | $203,000 |
Source: Public Records
Tax History Compared to Growth
Tax History
| Year | Tax Paid | Tax Assessment Tax Assessment Total Assessment is a certain percentage of the fair market value that is determined by local assessors to be the total taxable value of land and additions on the property. | Land | Improvement |
|---|---|---|---|---|
| 2025 | $6,413 | $509,876 | $347,743 | $162,133 |
| 2024 | $6,413 | $499,879 | $340,925 | $158,954 |
| 2023 | $6,298 | $490,079 | $334,241 | $155,838 |
| 2022 | $6,019 | $480,471 | $327,688 | $152,783 |
| 2021 | $5,939 | $471,051 | $321,263 | $149,788 |
| 2020 | $5,996 | $466,222 | $317,969 | $148,253 |
| 2019 | $5,768 | $457,082 | $311,735 | $145,347 |
| 2018 | $5,618 | $448,121 | $305,623 | $142,498 |
| 2016 | $5,367 | $430,721 | $293,756 | $136,965 |
| 2015 | $5,291 | $424,252 | $289,344 | $134,908 |
| 2014 | $5,316 | $415,943 | $283,677 | $132,266 |
Source: Public Records
Map
Nearby Homes
- 8363 Stewart Ave
- 8536 Mcconnell Ave
- 8353 Dunbarton Ave
- 8309 Westlawn Ave
- 8333 Chase Ave
- 6537 W 84th Place
- 6521 W 85th St
- 7000 W 85th St
- 6460 W 84th St
- 6606 W 80th Place
- 6411 W 85th St
- 8309 Regis Way
- 6410 W 84th Place
- 8000 Westlawn Ave
- 8136 Holy Cross Place
- 7933 Kenyon Ave
- 6356 W 83rd St
- 8044 Cowan Ave
- 8056 Kentwood Ave
- 7841 Stewart Ave
- 6700 W 85th Place
- 6710 W 85th Place
- 6680 W 85th Place
- 6716 W 85th Place
- 6676 W 85th Place
- 6720 W 85th Place
- 8387 Stewart Ave
- 8396 Kenyon Ave
- 6670 W 85th Place
- 6726 W 85th Place
- 8383 Stewart Ave
- 8388 Stewart Ave
- 8392 Kenyon Ave
- 6715 W 86th Plaza Unit 6
- 6666 W 85th Place
- 6730 W 85th Place
- 6715 W 86th Place
- 8379 Stewart Ave
- 6719 W 86th Place
- 8384 Stewart Ave