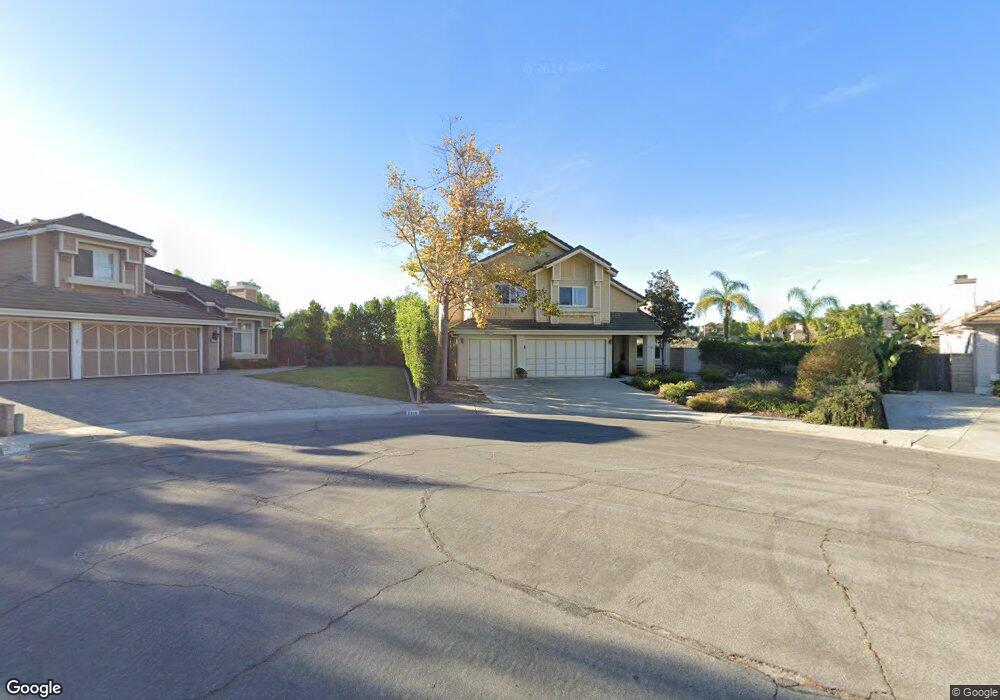
6708 Lafayette Ct Moorpark, CA 93021
Estimated Value: $940,000 - $1,187,000
3
Beds
3
Baths
2,174
Sq Ft
$469/Sq Ft
Est. Value
About This Home
This home is located at 6708 Lafayette Ct, Moorpark, CA 93021 and is currently estimated at $1,019,963, approximately $469 per square foot. 6708 Lafayette Ct is a home located in Ventura County with nearby schools including Campus Canyon College Preparatory Academy, Moorpark High School, and Ivytech Charter School.
Ownership History
Date
Name
Owned For
Owner Type
Purchase Details
Closed on
Apr 28, 2008
Sold by
Meinke Nancy G
Bought by
Meinke Nancy G
Current Estimated Value
Purchase Details
Closed on
Sep 29, 2005
Sold by
Meinke Gary F
Bought by
Meinke Nancy G
Purchase Details
Closed on
Oct 31, 1994
Sold by
The Sisseck Family #1 Ltd Partnership
Bought by
Meinke Gary F and Meinke Nancy G
Home Financials for this Owner
Home Financials are based on the most recent Mortgage that was taken out on this home.
Original Mortgage
$180,000
Interest Rate
9.08%
Purchase Details
Closed on
Apr 4, 1994
Sold by
Sisseck Ronald R and Sisseck Deborah N
Bought by
The Sisseck Family #1 Ltd Partnership
Purchase Details
Closed on
Nov 8, 1993
Sold by
Sisseck Deborah N
Bought by
Sisseck Ronald R and Sisseck Deborah N
Home Financials for this Owner
Home Financials are based on the most recent Mortgage that was taken out on this home.
Original Mortgage
$205,500
Interest Rate
6.51%
Create a Home Valuation Report for This Property
The Home Valuation Report is an in-depth analysis detailing your home's value as well as a comparison with similar homes in the area
Home Values in the Area
Average Home Value in this Area
Purchase History
| Date | Buyer | Sale Price | Title Company |
|---|---|---|---|
| Meinke Nancy G | -- | None Available | |
| Meinke Nancy G | -- | -- | |
| Meinke Gary F | $285,000 | Commonwealth Land Title Co | |
| The Sisseck Family #1 Ltd Partnership | -- | -- | |
| Sisseck Ronald R | -- | United Title Company |
Source: Public Records
Mortgage History
| Date | Status | Borrower | Loan Amount |
|---|---|---|---|
| Previous Owner | Meinke Gary F | $180,000 | |
| Previous Owner | Sisseck Ronald R | $205,500 |
Source: Public Records
Tax History Compared to Growth
Tax History
| Year | Tax Paid | Tax Assessment Tax Assessment Total Assessment is a certain percentage of the fair market value that is determined by local assessors to be the total taxable value of land and additions on the property. | Land | Improvement |
|---|---|---|---|---|
| 2025 | $5,088 | $478,639 | $191,454 | $287,185 |
| 2024 | $5,088 | $469,254 | $187,700 | $281,554 |
| 2023 | $4,974 | $460,053 | $184,019 | $276,034 |
| 2022 | $4,844 | $451,033 | $180,411 | $270,622 |
| 2021 | $4,833 | $442,190 | $176,874 | $265,316 |
| 2020 | $4,787 | $437,658 | $175,061 | $262,597 |
| 2019 | $4,679 | $429,078 | $171,629 | $257,449 |
| 2018 | $4,630 | $420,665 | $168,264 | $252,401 |
| 2017 | $4,532 | $412,417 | $164,965 | $247,452 |
| 2016 | $4,445 | $404,331 | $161,731 | $242,600 |
| 2015 | $4,383 | $398,259 | $159,302 | $238,957 |
| 2014 | -- | $390,460 | $156,183 | $234,277 |
Source: Public Records
Map
Nearby Homes
- 14291 Clemson St
- 6860 Ivy Creek Way Unit 6860
- 14720 Marymount St
- 13687 Blue Ridge Way
- 14744 Marymount St
- 15299 Middle Ranch Rd
- 0 N Grimes Canyon Rd Unit V1-29783
- 14855 Campus Park Dr Unit D
- 6899 Chapman Place
- 7313 Rocky Top Cir
- 14885 Campus Park Dr Unit C
- 6412 Penn St Unit C
- 15020 Varsity St Unit A
- 15076 Varsity St Unit A
- 7375 Elk Run Way
- 13170 Bent Grass Place
- 1363 Walnut Canyon Rd
- 15175 Marquette St Unit C
- 6590 Marquette St Unit C
- 15242 Campus Park Dr Unit E
- 6724 Lafayette Ct
- 6709 Lafayette Ct
- 6742 Lafayette Ct
- 6725 Lafayette Ct
- 6743 Lafayette Ct
- 6758 Lafayette Ct
- 6759 Lafayette Ct
- 6773 Lafayette Ct
- 6774 Lafayette Ct
- 6791 Lafayette Ct
- 6790 Lafayette Ct
- 6813 Lafayette Ct
- 6839 Lafayette Ct
- 6693 Westwood St
- 6713 Westwood St
- 6677 Westwood St
- 6739 Westwood St
- 6586 College Heights Dr
- 6661 Westwood St
- 6560 College Heights Dr