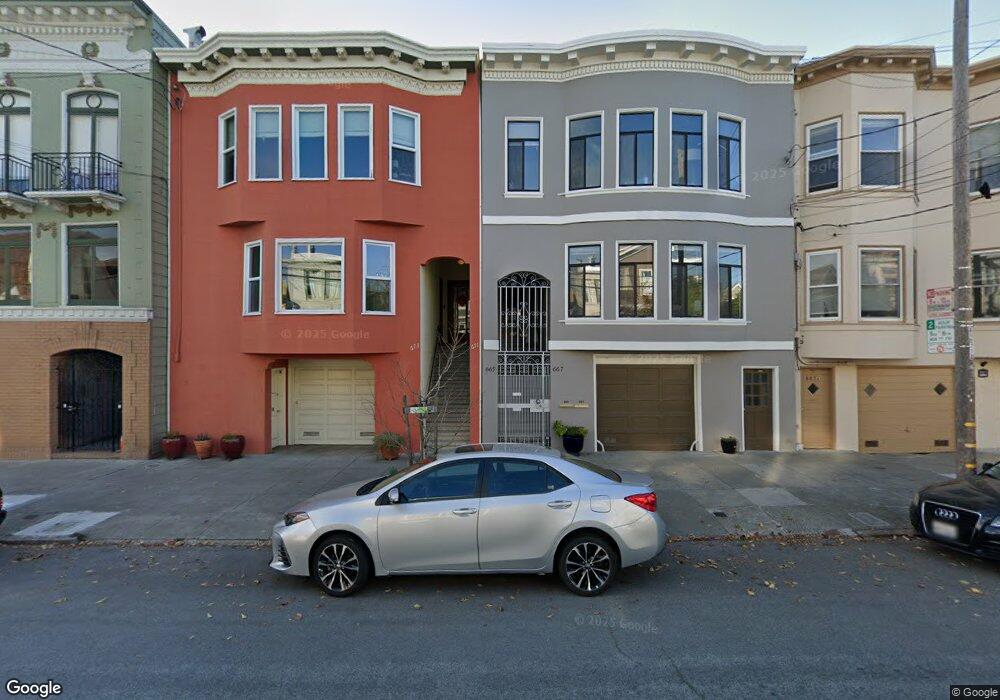
671 10th Ave Unit 673 San Francisco, CA 94118
Inner Richmond NeighborhoodEstimated Value: $1,634,000 - $2,417,750
Studio
3
Baths
3,930
Sq Ft
$513/Sq Ft
Est. Value
About This Home
This home is located at 671 10th Ave Unit 673, San Francisco, CA 94118 and is currently estimated at $2,016,188, approximately $513 per square foot. 671 10th Ave Unit 673 is a home located in San Francisco County with nearby schools including Frank McCoppin Elementary, Roosevelt Middle School, and Stratford School - San Francisco 14th Avenue.
Ownership History
Date
Name
Owned For
Owner Type
Purchase Details
Closed on
Aug 4, 2021
Sold by
Johnson Nancy A and Hutchinson Jill M
Bought by
Hutchinson Jill M and Johnson Nancy A
Current Estimated Value
Home Financials for this Owner
Home Financials are based on the most recent Mortgage that was taken out on this home.
Original Mortgage
$750,000
Outstanding Balance
$674,579
Interest Rate
2.9%
Mortgage Type
New Conventional
Estimated Equity
$1,341,609
Purchase Details
Closed on
Mar 20, 2019
Sold by
Waggener Susan
Bought by
Waggener Susan B
Purchase Details
Closed on
Sep 17, 2002
Sold by
Waggener Susan
Bought by
Johnson Nancy and Waggener Susan
Purchase Details
Closed on
Jul 15, 1992
Sold by
Waggener Gloria Anne
Bought by
Gloria Waggener 1992 Revocable Trust
Create a Home Valuation Report for This Property
The Home Valuation Report is an in-depth analysis detailing your home's value as well as a comparison with similar homes in the area
Home Values in the Area
Average Home Value in this Area
Purchase History
| Date | Buyer | Sale Price | Title Company |
|---|---|---|---|
| Hutchinson Jill M | -- | Old Republic Title | |
| Johnson Nancy A | -- | Old Republic Title | |
| Waggener Susan B | -- | None Available | |
| Johnson Nancy | -- | -- | |
| Gloria Waggener 1992 Revocable Trust | -- | -- |
Source: Public Records
Mortgage History
| Date | Status | Borrower | Loan Amount |
|---|---|---|---|
| Open | Johnson Nancy A | $750,000 |
Source: Public Records
Tax History
| Year | Tax Paid | Tax Assessment Tax Assessment Total Assessment is a certain percentage of the fair market value that is determined by local assessors to be the total taxable value of land and additions on the property. | Land | Improvement |
|---|---|---|---|---|
| 2025 | $4,692 | $339,838 | $135,924 | $203,914 |
| 2024 | $4,692 | $333,176 | $133,260 | $199,916 |
| 2023 | $4,613 | $326,646 | $130,648 | $195,998 |
| 2022 | $4,511 | $320,244 | $128,088 | $192,156 |
| 2021 | $4,426 | $313,968 | $125,578 | $188,390 |
| 2020 | $4,564 | $310,752 | $124,292 | $186,460 |
| 2019 | $4,416 | $304,660 | $121,856 | $182,804 |
| 2018 | $4,262 | $298,688 | $119,468 | $179,220 |
| 2017 | $3,915 | $292,832 | $117,126 | $175,706 |
| 2016 | $3,817 | $287,092 | $114,830 | $172,262 |
| 2015 | $3,763 | $282,782 | $113,106 | $169,676 |
| 2014 | $3,666 | $277,246 | $110,892 | $166,354 |
Source: Public Records
Map
Nearby Homes
- 546 9th Ave
- 700 12th Ave Unit 4
- 700 12th Ave Unit A
- 659 12th Ave
- 558-560 Balboa St
- 772 8th Ave Unit 3
- 456 11th Ave Unit 456
- 456 11th Ave
- 458 11th Ave Unit 458
- 3036 Fulton St Unit 1
- 373 6th Ave
- 326 11th Ave
- 375 15th Ave
- 4138-4140 Fulton St
- 631 18th Ave
- 263-265 8th Ave
- 618 19th Ave
- 334-336 4th Ave
- 4829 California St
- 255 5th Ave
- 667 10th Ave Unit 669
- 663 10th Ave Unit 665
- 675 10th Ave Unit 677
- 675 10th Ave
- 659 10th Ave Unit 661
- 681 10th Ave
- 655 10th Ave
- 676 10th Ave
- 695 10th Ave
- 670 10th Ave
- 691 10th Ave
- 666 10th Ave
- 908 Cabrillo St
- 674 10th Ave
- 662 10th Ave Unit 664
- 647 10th Ave Unit 649
- 914 Cabrillo St
- 678 10th Ave
- 658 10th Ave
- 660 10th Ave Unit 660
Your Personal Tour Guide
Ask me questions while you tour the home.