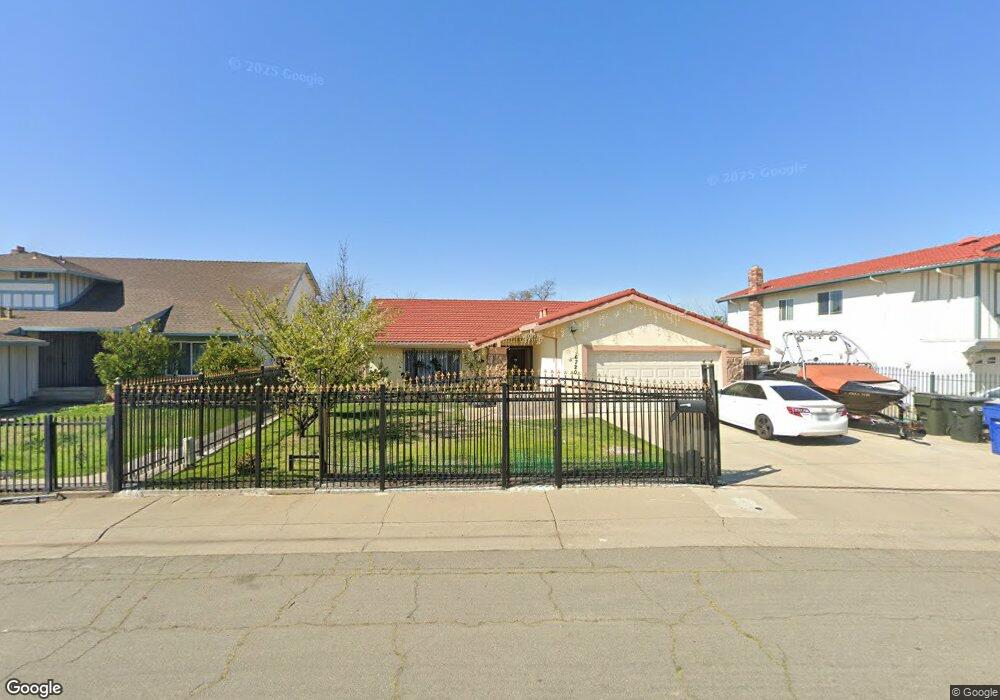
6720 Cunningham Way Sacramento, CA 95828
Southeast Village NeighborhoodEstimated Value: $341,000 - $463,000
4
Beds
2
Baths
1,719
Sq Ft
$249/Sq Ft
Est. Value
About This Home
This home is located at 6720 Cunningham Way, Sacramento, CA 95828 and is currently estimated at $428,259, approximately $249 per square foot. 6720 Cunningham Way is a home located in Sacramento County with nearby schools including Camellia Elementary School, Elder Creek Elementary School, and Will C. Wood Middle School.
Ownership History
Date
Name
Owned For
Owner Type
Purchase Details
Closed on
Jun 3, 2019
Sold by
Huang Yaxing
Bought by
Li Katie
Current Estimated Value
Purchase Details
Closed on
Aug 5, 2010
Sold by
Li Katie
Bought by
Phong Peter and Hoang Vi Chi
Purchase Details
Closed on
Dec 18, 2006
Sold by
Pham Lisa Ben and Levan Harry
Bought by
Li Katie
Home Financials for this Owner
Home Financials are based on the most recent Mortgage that was taken out on this home.
Original Mortgage
$224,000
Interest Rate
6.22%
Mortgage Type
Purchase Money Mortgage
Purchase Details
Closed on
Feb 6, 2003
Sold by
Pham Lisa Ben and Pham Lisa B
Bought by
Levan Harry and Pham Lisa Ben
Home Financials for this Owner
Home Financials are based on the most recent Mortgage that was taken out on this home.
Original Mortgage
$120,900
Interest Rate
5.76%
Mortgage Type
Stand Alone First
Create a Home Valuation Report for This Property
The Home Valuation Report is an in-depth analysis detailing your home's value as well as a comparison with similar homes in the area
Home Values in the Area
Average Home Value in this Area
Purchase History
| Date | Buyer | Sale Price | Title Company |
|---|---|---|---|
| Li Katie | -- | Chicago Title Company | |
| Li Katie | $135,000 | Chicago Title Company | |
| Phong Peter | -- | Chicago Title Company | |
| Phong Peter | $128,000 | Fidelity National Title Co | |
| Li Katie | $280,000 | First American Title Company | |
| Levan Harry | -- | Chicago Title Co |
Source: Public Records
Mortgage History
| Date | Status | Borrower | Loan Amount |
|---|---|---|---|
| Previous Owner | Li Katie | $224,000 | |
| Previous Owner | Levan Harry | $120,900 |
Source: Public Records
Tax History Compared to Growth
Tax History
| Year | Tax Paid | Tax Assessment Tax Assessment Total Assessment is a certain percentage of the fair market value that is determined by local assessors to be the total taxable value of land and additions on the property. | Land | Improvement |
|---|---|---|---|---|
| 2025 | $4,994 | $311,682 | $87,488 | $224,194 |
| 2024 | $4,994 | $305,572 | $85,773 | $219,799 |
| 2023 | $4,073 | $299,582 | $84,092 | $215,490 |
| 2022 | $3,518 | $293,709 | $82,444 | $211,265 |
| 2021 | $3,352 | $287,951 | $80,828 | $207,123 |
| 2020 | $3,377 | $285,000 | $80,000 | $205,000 |
| 2019 | $1,879 | $147,003 | $28,710 | $118,293 |
| 2018 | $1,830 | $144,122 | $28,148 | $115,974 |
| 2017 | $1,804 | $141,297 | $27,597 | $113,700 |
| 2016 | $1,762 | $138,527 | $27,056 | $111,471 |
| 2015 | $1,736 | $136,447 | $26,650 | $109,797 |
| 2014 | $1,692 | $133,775 | $26,128 | $107,647 |
Source: Public Records
Map
Nearby Homes
- 6719 Representative Way Unit 166
- 6724 Capital Dr
- 6300 Election Ln Unit 118
- 6616 Capital Dr Unit 81
- 6304 Convention Ln Unit 108
- 6311 Convention Ln Unit 100
- 6206 Presidential Ln Unit 141
- 6827 Capital Cir Unit 203
- 6825 Capital Cir Unit 204
- 6757 Rancho Adobe Dr
- 6224 Fowler Ave
- 6659 Spoerriwood Ct
- 18 Lake House Ct
- 6417 Capital Cir Unit 9
- 6955 Lawnwood Dr
- 6532 Harley Way
- 6912 Richeve Way
- 6935 Arvada Ct
- 6451 Elder Creek Rd
- 6775 Briggs Dr
- 6740 Cunningham Way
- 6700 Cunningham Way
- 6760 Cunningham Way
- 6721 Cunningham Way
- 6741 Cunningham Way
- 6701 63rd St Unit 190
- 6709 Capital Cir Unit 234
- 6701 Cunningham Way
- 6707 Capital Cir Unit 235
- 6780 Cunningham Way
- 6713 Capital Cir Unit 232
- 6690 Cunningham Way
- 6705 Capital Cir Unit 236
- 6703 Capital Cir Unit 237
- 6695 Cunningham Way
- 6732 Rancho Grande Way
- 6800 Cunningham Way
- 6750 Rancho Grande Way
- 6701 Capital Cir Unit 238
- 6869 Rancho Adobe Dr