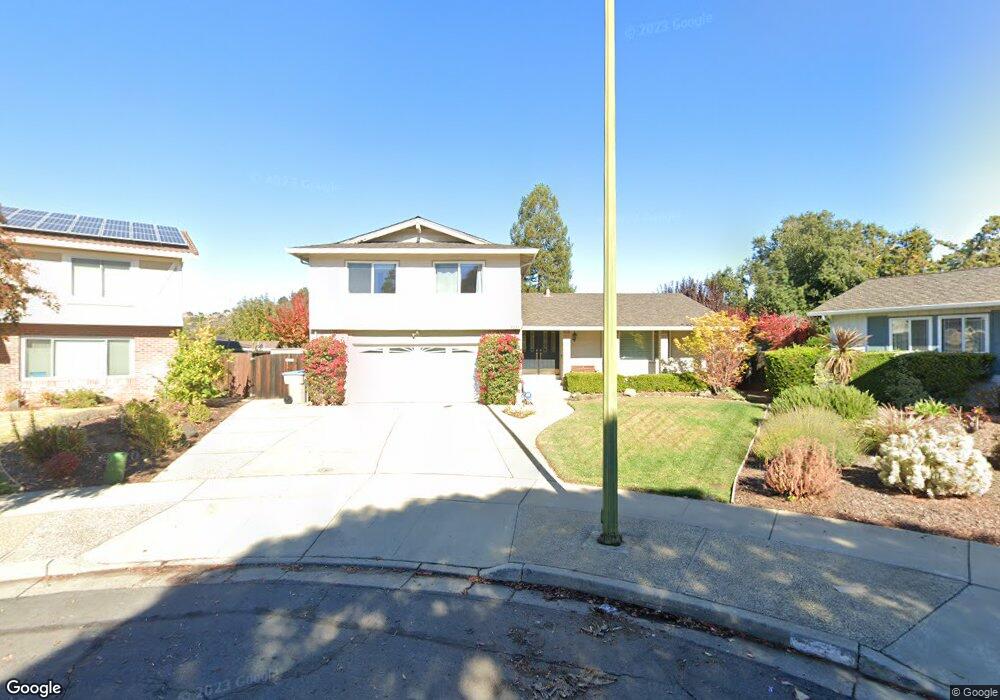
6725 Bitterroot Place San Jose, CA 95120
Shadow Brook NeighborhoodEstimated Value: $2,207,692 - $2,475,000
4
Beds
3
Baths
2,240
Sq Ft
$1,060/Sq Ft
Est. Value
About This Home
This home is located at 6725 Bitterroot Place, San Jose, CA 95120 and is currently estimated at $2,373,923, approximately $1,059 per square foot. 6725 Bitterroot Place is a home located in Santa Clara County with nearby schools including Graystone Elementary School, Bret Harte Middle School, and Leland High School.
Ownership History
Date
Name
Owned For
Owner Type
Purchase Details
Closed on
Aug 3, 2017
Sold by
Crotty Patrick J and Crotty Teresa T
Bought by
Crotty Patrick J and Crotty Teresa T
Current Estimated Value
Purchase Details
Closed on
Nov 8, 2006
Sold by
Feldman Barry Joel and Feldman Cynthia Louise
Bought by
Crotty Patrick J and Crotty Teresa T
Home Financials for this Owner
Home Financials are based on the most recent Mortgage that was taken out on this home.
Original Mortgage
$108,000
Outstanding Balance
$64,420
Interest Rate
6.36%
Mortgage Type
Credit Line Revolving
Estimated Equity
$2,309,503
Purchase Details
Closed on
Jul 16, 1996
Sold by
Jones Jackie R and Jones Christel R
Bought by
Feldman Barry Joel and Feldman Cynthia Louise
Home Financials for this Owner
Home Financials are based on the most recent Mortgage that was taken out on this home.
Original Mortgage
$355,105
Interest Rate
8.39%
Create a Home Valuation Report for This Property
The Home Valuation Report is an in-depth analysis detailing your home's value as well as a comparison with similar homes in the area
Home Values in the Area
Average Home Value in this Area
Purchase History
| Date | Buyer | Sale Price | Title Company |
|---|---|---|---|
| Crotty Patrick J | -- | None Available | |
| Crotty Patrick J | $1,080,000 | First American Title Co | |
| Feldman Barry Joel | $395,000 | First American Title Guarant |
Source: Public Records
Mortgage History
| Date | Status | Borrower | Loan Amount |
|---|---|---|---|
| Open | Crotty Patrick J | $108,000 | |
| Open | Crotty Patrick J | $864,000 | |
| Previous Owner | Feldman Barry Joel | $355,105 |
Source: Public Records
Tax History
| Year | Tax Paid | Tax Assessment Tax Assessment Total Assessment is a certain percentage of the fair market value that is determined by local assessors to be the total taxable value of land and additions on the property. | Land | Improvement |
|---|---|---|---|---|
| 2025 | $17,865 | $1,446,956 | $1,085,222 | $361,734 |
| 2024 | $17,865 | $1,418,586 | $1,063,944 | $354,642 |
| 2023 | $17,865 | $1,390,772 | $1,043,083 | $347,689 |
| 2022 | $17,398 | $1,363,503 | $1,022,631 | $340,872 |
| 2021 | $17,075 | $1,336,769 | $1,002,580 | $334,189 |
| 2020 | $16,716 | $1,323,063 | $992,300 | $330,763 |
| 2019 | $16,375 | $1,297,122 | $972,844 | $324,278 |
| 2018 | $16,226 | $1,271,689 | $953,769 | $317,920 |
| 2017 | $16,022 | $1,246,755 | $935,068 | $311,687 |
| 2016 | $15,802 | $1,222,310 | $916,734 | $305,576 |
| 2015 | $15,707 | $1,203,950 | $902,964 | $300,986 |
| 2014 | $15,219 | $1,180,368 | $885,277 | $295,091 |
Source: Public Records
Map
Nearby Homes
- 20011 Graystone Ln
- 1031 Mount Darwin Dr
- 6823 Trinidad Dr
- 1036 Bret Cove Ct
- 6805 Almaden Rd
- 6644 Mount Hope Dr
- 6964 Lenwood Way
- 7013 Silver Fox Dr
- 1156 Lansdale Ct
- 1115 Bartlett Creek Ct
- 1168 Valley Quail Cir
- 21287 Almaden Rd
- 20300 Almaden Rd
- 7081 Elmsdale Dr
- 993 Woodview Place
- 951 Wallace Dr
- 1182 Olive Branch Ln
- 6448 Menlo Dr
- 6380 Vegas Dr
- 1059 Quail Creek Cir
- 6723 Bitterroot Place
- 6727 Bitterroot Place
- 6699 Charter Oak Place
- 6724 Bitterroot Place
- 972 Shadow Brook Dr
- 6692 Charter Oak Place
- 968 Shadow Brook Dr
- 6693 Charter Oak Place
- 962 Shadow Brook Dr
- 6726 Bitterroot Place
- 982 Shadow Brook Dr
- 6687 Charter Oak Place
- 958 Shadow Brook Dr
- 986 Shadow Brook Dr
- 6681 Charter Oak Place
- 6658 Bret Harte Dr
- 6654 Bret Harte Dr
- 6678 Charter Oak Place
- 971 Shadow Brook Dr
Your Personal Tour Guide
Ask me questions while you tour the home.