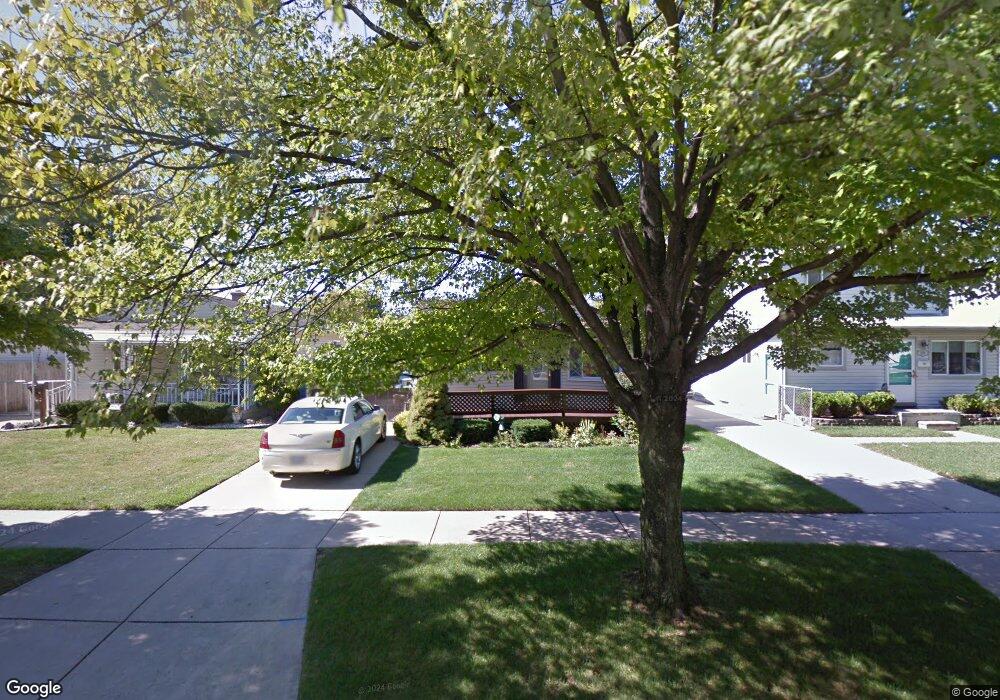
6728 Pine St Taylor, MI 48180
Estimated Value: $168,706 - $196,000
Studio
--
Bath
1,284
Sq Ft
$141/Sq Ft
Est. Value
About This Home
This home is located at 6728 Pine St, Taylor, MI 48180 and is currently estimated at $180,927, approximately $140 per square foot. 6728 Pine St is a home located in Wayne County with nearby schools including Clarence Randall Elementary School, Hoover Middle School, and Quest Charter Academy.
Ownership History
Date
Name
Owned For
Owner Type
Purchase Details
Closed on
Jan 23, 2017
Sold by
Myers Patricia Ann and Myers Hugh Harvie
Bought by
Myers Patricia Ann and Myers Family Revocable Living Trust
Current Estimated Value
Purchase Details
Closed on
May 10, 2013
Sold by
Myers Hugh Harvie and Myers Patricia Ann
Bought by
Myers Hugh Harvie and Myers Patricia Ann
Purchase Details
Closed on
Dec 21, 2007
Sold by
Myers Hugh Harvie and Myers Patricia Ann
Bought by
Myers Hugh Harvie
Create a Home Valuation Report for This Property
The Home Valuation Report is an in-depth analysis detailing your home's value as well as a comparison with similar homes in the area
Home Values in the Area
Average Home Value in this Area
Purchase History
| Date | Buyer | Sale Price | Title Company |
|---|---|---|---|
| Myers Patricia Ann | -- | None Available | |
| Myers Hugh Harvie | -- | None Available | |
| Myers Hugh Harvie | -- | None Available | |
| Myers Hugh Harvie | -- | None Available |
Source: Public Records
Tax History
| Year | Tax Paid | Tax Assessment Tax Assessment Total Assessment is a certain percentage of the fair market value that is determined by local assessors to be the total taxable value of land and additions on the property. | Land | Improvement |
|---|---|---|---|---|
| 2025 | $1,796 | $98,500 | $0 | $0 |
| 2024 | $1,739 | $88,300 | $0 | $0 |
| 2023 | $2,076 | $79,500 | $0 | $0 |
| 2022 | $1,660 | $72,400 | $0 | $0 |
| 2021 | $1,826 | $66,400 | $0 | $0 |
| 2020 | $1,807 | $59,400 | $0 | $0 |
| 2019 | $180,726 | $49,000 | $0 | $0 |
| 2018 | $1,425 | $37,900 | $0 | $0 |
| 2017 | $771 | $38,500 | $0 | $0 |
| 2016 | $1,761 | $37,400 | $0 | $0 |
| 2015 | $3,220 | $32,200 | $0 | $0 |
| 2013 | $3,410 | $34,100 | $0 | $0 |
| 2012 | $1,469 | $33,100 | $7,300 | $25,800 |
Source: Public Records
Map
Nearby Homes
Your Personal Tour Guide
Ask me questions while you tour the home.