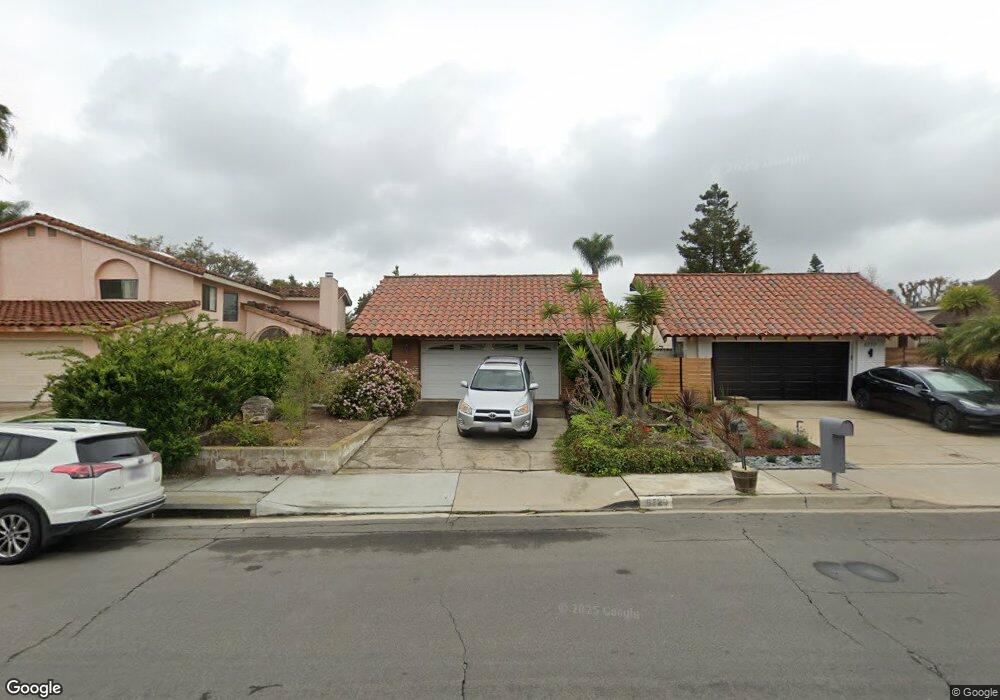
6729 Corintia St Unit 1 Carlsbad, CA 92009
La Costa NeighborhoodEstimated Value: $817,982 - $939,000
3
Beds
2
Baths
1,369
Sq Ft
$634/Sq Ft
Est. Value
About This Home
This home is located at 6729 Corintia St Unit 1, Carlsbad, CA 92009 and is currently estimated at $868,496, approximately $634 per square foot. 6729 Corintia St Unit 1 is a home located in San Diego County with nearby schools including La Costa Meadows Elementary, San Elijo Middle School, and San Marcos High School.
Ownership History
Date
Name
Owned For
Owner Type
Purchase Details
Closed on
Jun 12, 2018
Sold by
Gauntlett Deaney D
Bought by
Gauntlett Deaney D
Current Estimated Value
Purchase Details
Closed on
Apr 3, 2003
Sold by
Lubitz Julie A
Bought by
Gauntlett Deaney
Home Financials for this Owner
Home Financials are based on the most recent Mortgage that was taken out on this home.
Original Mortgage
$157,250
Outstanding Balance
$66,511
Interest Rate
5.54%
Estimated Equity
$801,985
Purchase Details
Closed on
Aug 28, 2002
Sold by
Burke Susan K
Bought by
Burke Susan Kay
Purchase Details
Closed on
Mar 20, 1995
Sold by
Nafarrate Ray S
Bought by
Burke Susan K
Purchase Details
Closed on
Jul 29, 1988
Create a Home Valuation Report for This Property
The Home Valuation Report is an in-depth analysis detailing your home's value as well as a comparison with similar homes in the area
Home Values in the Area
Average Home Value in this Area
Purchase History
| Date | Buyer | Sale Price | Title Company |
|---|---|---|---|
| Gauntlett Deaney D | -- | None Available | |
| Gauntlett Deaney | $314,500 | Chicago Title Co | |
| Burke Susan Kay | -- | -- | |
| Burke Susan K | -- | -- | |
| -- | $115,000 | -- |
Source: Public Records
Mortgage History
| Date | Status | Borrower | Loan Amount |
|---|---|---|---|
| Open | Gauntlett Deaney | $157,250 |
Source: Public Records
Tax History Compared to Growth
Tax History
| Year | Tax Paid | Tax Assessment Tax Assessment Total Assessment is a certain percentage of the fair market value that is determined by local assessors to be the total taxable value of land and additions on the property. | Land | Improvement |
|---|---|---|---|---|
| 2025 | $5,291 | $455,484 | $333,107 | $122,377 |
| 2024 | $5,291 | $446,554 | $326,576 | $119,978 |
| 2023 | $5,138 | $437,799 | $320,173 | $117,626 |
| 2022 | $5,016 | $429,216 | $313,896 | $115,320 |
| 2021 | $4,898 | $420,801 | $307,742 | $113,059 |
| 2020 | $4,829 | $416,487 | $304,587 | $111,900 |
| 2019 | $4,807 | $408,321 | $298,615 | $109,706 |
| 2018 | $4,695 | $400,315 | $292,760 | $107,555 |
| 2017 | $4,609 | $392,467 | $287,020 | $105,447 |
| 2016 | $4,535 | $384,773 | $281,393 | $103,380 |
| 2015 | $4,442 | $378,995 | $277,167 | $101,828 |
| 2014 | $4,318 | $371,572 | $271,738 | $99,834 |
Source: Public Records
Map
Nearby Homes
- 6712 Cantil St
- 6844 Urubu St
- 2568 Abedul St
- 6541 Vispera Place
- 2515 Luciernaga St
- 7133 Obelisco Cir
- 7146 Argonauta Way
- 6817 Vianda Ct
- 6977 Corte Langosta
- 2610 Acuna Ct
- 6502 La Paloma St
- 7215 El Fuerte St
- 2647 Marmol Ct
- 3519 Via Nido
- 7319 Bolero St
- 6911 Goldstone Rd
- 6839 Helenite Place
- 2930 Rancho Cortes
- 7394 Altiva Place
- 2402 Altisma Way Unit G
- 6723 Corintia St
- 6721 Corintia St Unit 2
- 6733 Corintia St Unit 35
- 2750 Abejorro St
- 2752 Abejorro St Unit 2
- 6737 Corintia St
- 6717 Corintia St
- 2715 Anta Ct
- 6715 Corintia St
- 6739 Corintia St
- 2723 Anta Ct
- 2725 Anta Ct Unit 1
- 6741 Corintia St Unit 1
- 2717 Anta Ct
- 6738 Corintia St
- 2744 Abejorro St Carlsbad Ca 92009
- 2744 Abejorro St Unit 2
- 6736 Corintia St
- 2742 Abejorro St
- 6722 Corintia St Unit 24