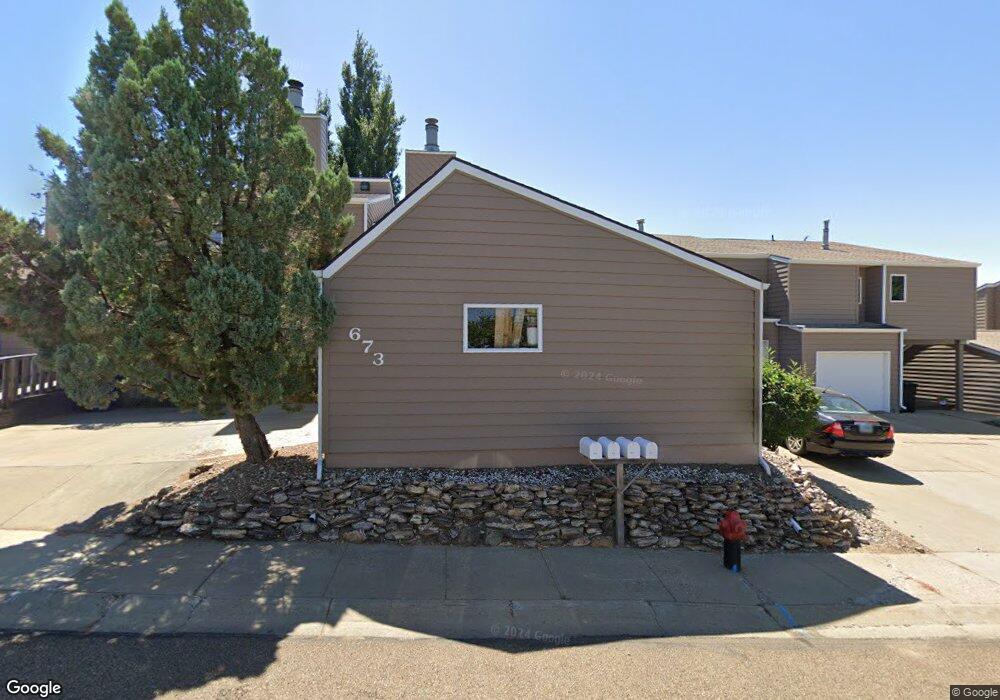
673 Hillside Dr Dickinson, ND 58601
Estimated Value: $227,940 - $300,000
2
Beds
3
Baths
1,439
Sq Ft
$176/Sq Ft
Est. Value
About This Home
This home is located at 673 Hillside Dr, Dickinson, ND 58601 and is currently estimated at $253,485, approximately $176 per square foot. 673 Hillside Dr is a home located in Stark County with nearby schools including Trinity Catholic Schools.
Ownership History
Date
Name
Owned For
Owner Type
Purchase Details
Closed on
Sep 12, 2008
Sold by
Swalling Rou O and Swalling Julie A
Bought by
Crosby Darin J and Crosby Terri L
Current Estimated Value
Home Financials for this Owner
Home Financials are based on the most recent Mortgage that was taken out on this home.
Original Mortgage
$34,000
Outstanding Balance
$22,202
Interest Rate
6.57%
Mortgage Type
New Conventional
Estimated Equity
$231,283
Purchase Details
Closed on
Mar 3, 2006
Sold by
Jocobs M Ory
Bought by
Swalling Roy O and Swalling Julie A
Home Financials for this Owner
Home Financials are based on the most recent Mortgage that was taken out on this home.
Original Mortgage
$79,200
Interest Rate
6.33%
Mortgage Type
New Conventional
Create a Home Valuation Report for This Property
The Home Valuation Report is an in-depth analysis detailing your home's value as well as a comparison with similar homes in the area
Home Values in the Area
Average Home Value in this Area
Purchase History
| Date | Buyer | Sale Price | Title Company |
|---|---|---|---|
| Crosby Darin J | -- | None Available | |
| Swalling Roy O | -- | Title & Escrow Inc |
Source: Public Records
Mortgage History
| Date | Status | Borrower | Loan Amount |
|---|---|---|---|
| Open | Crosby Darin J | $34,000 | |
| Previous Owner | Swalling Roy O | $79,200 |
Source: Public Records
Tax History
| Year | Tax Paid | Tax Assessment Tax Assessment Total Assessment is a certain percentage of the fair market value that is determined by local assessors to be the total taxable value of land and additions on the property. | Land | Improvement |
|---|---|---|---|---|
| 2025 | $449 | $169,200 | $13,800 | $155,400 |
| 2024 | $1,596 | $169,200 | $13,800 | $155,400 |
| 2023 | $1,832 | $169,200 | $13,800 | $155,400 |
| 2022 | $1,740 | $87,450 | $0 | $0 |
| 2021 | $1,688 | $164,100 | $13,800 | $150,300 |
| 2020 | $1,711 | $164,100 | $13,800 | $150,300 |
| 2019 | $1,716 | $164,100 | $13,800 | $150,300 |
| 2017 | $1,655 | $164,100 | $13,800 | $150,300 |
| 2015 | $1,655 | $189,000 | $13,900 | $175,100 |
| 2014 | $1,729 | $182,800 | $13,900 | $168,900 |
| 2013 | -- | $176,300 | $13,900 | $162,400 |
Source: Public Records
Map
Nearby Homes
Your Personal Tour Guide
Ask me questions while you tour the home.