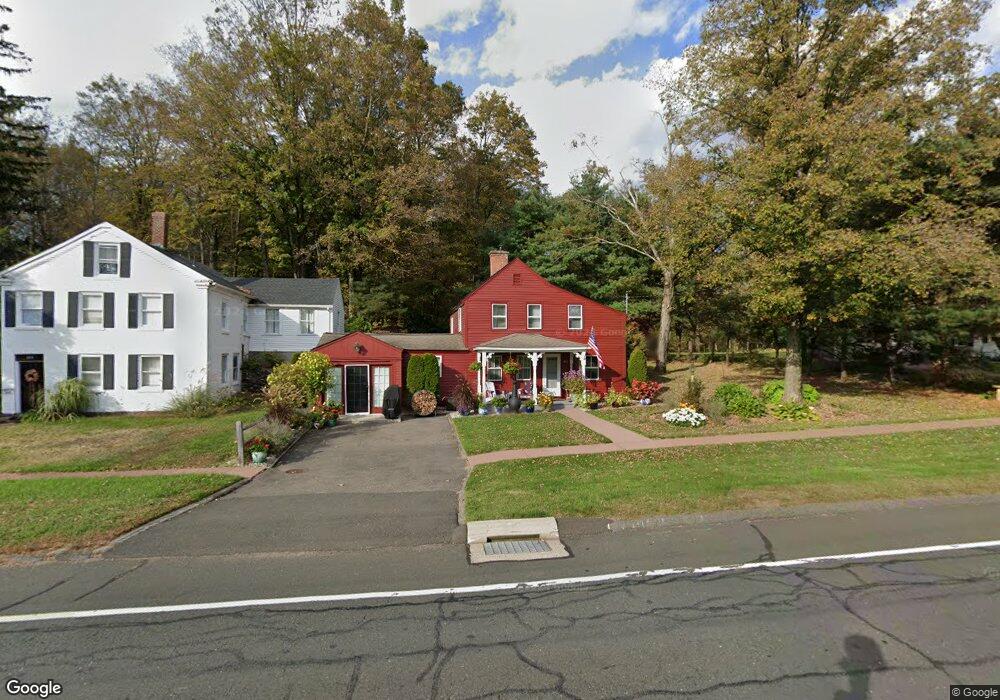
673 Main St Unit 673 Somers, CT 06071
Estimated Value: $282,000 - $341,000
2
Beds
1
Bath
1,336
Sq Ft
$233/Sq Ft
Est. Value
About This Home
This home is located at 673 Main St Unit 673, Somers, CT 06071 and is currently estimated at $311,444, approximately $233 per square foot. 673 Main St Unit 673 is a home located in Tolland County with nearby schools including Somers Elementary School, Mabelle B. Avery Middle School, and Somers High School.
Ownership History
Date
Name
Owned For
Owner Type
Purchase Details
Closed on
Nov 2, 2015
Sold by
Finn James T and Finn Jennie L
Bought by
Totman Patricia L
Current Estimated Value
Home Financials for this Owner
Home Financials are based on the most recent Mortgage that was taken out on this home.
Original Mortgage
$153,425
Outstanding Balance
$120,877
Interest Rate
3.92%
Mortgage Type
New Conventional
Estimated Equity
$190,567
Purchase Details
Closed on
Sep 10, 1998
Sold by
Est Nielsen David and Nielsen Raymond
Bought by
Finn Thomas and Finn Jennie
Purchase Details
Closed on
Mar 7, 1989
Sold by
Pease Clark
Bought by
Neilson David
Create a Home Valuation Report for This Property
The Home Valuation Report is an in-depth analysis detailing your home's value as well as a comparison with similar homes in the area
Home Values in the Area
Average Home Value in this Area
Purchase History
| Date | Buyer | Sale Price | Title Company |
|---|---|---|---|
| Totman Patricia L | -- | -- | |
| Totman Patricia L | -- | -- | |
| Totman Patricia L | $161,500 | -- | |
| Totman Patricia L | $161,500 | -- | |
| Finn Thomas | $85,000 | -- | |
| Finn Thomas | $85,000 | -- | |
| Neilson David | $130,000 | -- |
Source: Public Records
Mortgage History
| Date | Status | Borrower | Loan Amount |
|---|---|---|---|
| Open | Totman Patricia L | $153,425 | |
| Closed | Totman Patricia L | $153,425 | |
| Previous Owner | Neilson David | $150,000 | |
| Previous Owner | Neilson David | $60,000 |
Source: Public Records
Tax History Compared to Growth
Tax History
| Year | Tax Paid | Tax Assessment Tax Assessment Total Assessment is a certain percentage of the fair market value that is determined by local assessors to be the total taxable value of land and additions on the property. | Land | Improvement |
|---|---|---|---|---|
| 2025 | $3,332 | $110,300 | $34,900 | $75,400 |
| 2024 | $3,194 | $110,300 | $34,900 | $75,400 |
| 2023 | $3,123 | $110,300 | $34,900 | $75,400 |
| 2022 | $3,040 | $110,300 | $34,900 | $75,400 |
| 2021 | $2,941 | $110,300 | $34,900 | $75,400 |
| 2020 | $2,751 | $100,500 | $34,900 | $65,600 |
| 2019 | $5,877 | $94,600 | $36,100 | $58,500 |
| 2018 | $2,589 | $94,600 | $36,100 | $58,500 |
| 2017 | $2,409 | $94,600 | $36,100 | $58,500 |
| 2016 | $2,291 | $94,600 | $36,100 | $58,500 |
| 2015 | $2,337 | $100,000 | $42,700 | $57,300 |
| 2014 | $2,337 | $100,000 | $42,700 | $57,300 |
Source: Public Records
Map
Nearby Homes
- 100 Battle St
- 794 Main St
- 63 Maple Ridge Dr
- 969 Main St
- 32 Michele Dr
- 142 Turnpike Rd
- 69 Colton Rd
- 64 Bradfield Dr
- 121 Florida Rd
- 49 Franklin Woods Dr
- 17 Long Hill Dr
- 283 Mountain View Rd
- 310 South Rd
- 369 Turnpike Rd
- 1000 Main St
- 994 Main St
- 1040 Main St
- 64 Somerset Ln
- 63 Rose Haven Rd
- 92 Rose Haven Rd