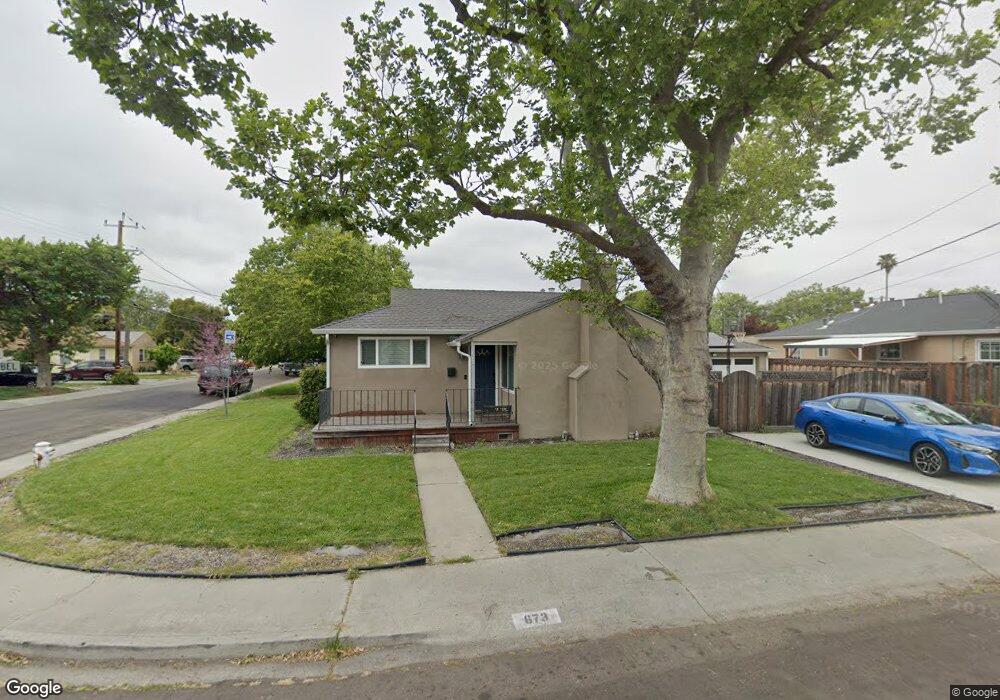
673 Via Mirabel San Lorenzo, CA 94580
Estimated Value: $787,298 - $835,000
3
Beds
2
Baths
1,260
Sq Ft
$642/Sq Ft
Est. Value
About This Home
This home is located at 673 Via Mirabel, San Lorenzo, CA 94580 and is currently estimated at $809,325, approximately $642 per square foot. 673 Via Mirabel is a home located in Alameda County with nearby schools including Bay Elementary School, Bohannon Middle School, and Arroyo High School.
Ownership History
Date
Name
Owned For
Owner Type
Purchase Details
Closed on
Oct 17, 2018
Sold by
Hensley Michelle M
Bought by
Hensley Stephen S and Hensley Michelle M
Current Estimated Value
Purchase Details
Closed on
May 29, 2009
Sold by
Hensley Stephen
Bought by
Hensley Michelle M
Home Financials for this Owner
Home Financials are based on the most recent Mortgage that was taken out on this home.
Original Mortgage
$294,566
Interest Rate
4.78%
Mortgage Type
FHA
Purchase Details
Closed on
Apr 9, 2009
Sold by
Federal Home Loan Mortgage Corporation
Bought by
Hensley Michelle M
Home Financials for this Owner
Home Financials are based on the most recent Mortgage that was taken out on this home.
Original Mortgage
$294,566
Interest Rate
4.78%
Mortgage Type
FHA
Purchase Details
Closed on
Jan 21, 2009
Sold by
Johnson Robert and Johnson Thelma
Bought by
Federal Home Loan Mortgage Corporation
Purchase Details
Closed on
Feb 6, 2008
Sold by
Kok Elaine and Staats Brian
Bought by
Johnson Robert and Johnson Thelma
Purchase Details
Closed on
Dec 14, 2006
Sold by
Johnson Robert and Johnson Thelma
Bought by
Kok Elaine
Purchase Details
Closed on
Jul 25, 2006
Sold by
Mitzman Marshall
Bought by
Johnson Robert and Johnson Thelma
Purchase Details
Closed on
Apr 6, 2005
Sold by
Ulep Felicidad
Bought by
Mitzman Marshall
Home Financials for this Owner
Home Financials are based on the most recent Mortgage that was taken out on this home.
Original Mortgage
$404,000
Interest Rate
2%
Mortgage Type
Purchase Money Mortgage
Purchase Details
Closed on
Apr 1, 2005
Sold by
Souza Elizabeth I and The Elizabeth I Souza Trust
Bought by
Mitzman Marshall
Home Financials for this Owner
Home Financials are based on the most recent Mortgage that was taken out on this home.
Original Mortgage
$404,000
Interest Rate
2%
Mortgage Type
Purchase Money Mortgage
Purchase Details
Closed on
Sep 30, 2002
Sold by
Souza Elizabeth Imelda and Elizabeth Imelda Souza 1995 Re
Bought by
Souza Elizabeth I and Elizabeth I Souza Trust
Purchase Details
Closed on
Sep 27, 1995
Sold by
Souza Imelda E
Bought by
Souza Elizabeth Imelda
Create a Home Valuation Report for This Property
The Home Valuation Report is an in-depth analysis detailing your home's value as well as a comparison with similar homes in the area
Home Values in the Area
Average Home Value in this Area
Purchase History
| Date | Buyer | Sale Price | Title Company |
|---|---|---|---|
| Hensley Stephen S | -- | None Available | |
| Hensley Michelle M | -- | Ticor Title Redlands | |
| Hensley Michelle M | $300,000 | Ticor Title Redlands | |
| Federal Home Loan Mortgage Corporation | $288,000 | Accommodation | |
| Johnson Robert | -- | None Available | |
| Kok Elaine | -- | None Available | |
| Johnson Robert | $530,000 | Old Republic Title Company | |
| Mitzman Marshall | -- | Chicago Title Co | |
| Mitzman Marshall | $505,000 | Chicago Title Co | |
| Souza Elizabeth I | -- | -- | |
| Souza Elizabeth Imelda | -- | -- |
Source: Public Records
Mortgage History
| Date | Status | Borrower | Loan Amount |
|---|---|---|---|
| Previous Owner | Hensley Michelle M | $294,566 | |
| Previous Owner | Mitzman Marshall | $404,000 | |
| Closed | Mitzman Marshall | $50,500 | |
| Closed | Johnson Robert | $0 |
Source: Public Records
Tax History Compared to Growth
Tax History
| Year | Tax Paid | Tax Assessment Tax Assessment Total Assessment is a certain percentage of the fair market value that is determined by local assessors to be the total taxable value of land and additions on the property. | Land | Improvement |
|---|---|---|---|---|
| 2025 | $5,210 | $379,300 | $115,890 | $270,410 |
| 2024 | $5,210 | $371,728 | $113,618 | $265,110 |
| 2023 | $5,191 | $371,303 | $111,391 | $259,912 |
| 2022 | $5,106 | $357,025 | $109,207 | $254,818 |
| 2021 | $4,962 | $349,888 | $107,066 | $249,822 |
| 2020 | $4,850 | $353,231 | $105,969 | $247,262 |
| 2019 | $4,849 | $346,307 | $103,892 | $242,415 |
| 2018 | $4,558 | $339,518 | $101,855 | $237,663 |
| 2017 | $4,351 | $332,861 | $99,858 | $233,003 |
| 2016 | $4,149 | $326,336 | $97,901 | $228,435 |
| 2015 | $4,057 | $321,437 | $96,431 | $225,006 |
| 2014 | $3,996 | $315,143 | $94,543 | $220,600 |
Source: Public Records
Map
Nearby Homes
- 16011 Via Conejo
- 0 E 14th St Unit 41059501
- 17472 Via Segundo
- 17221 Via Estrella
- 15741 Hesperian Blvd
- 16004 Via Granada
- 1086 Via Coralla
- 1088 Azalea Ct
- 18018 Sahara Rd
- 19150 Hesperian Blvd Unit 19
- 15822 Devonwood Way
- 72 Via Morella
- 15839 Via Cordoba
- 17453 Via Valencia
- 19092 Ricardo Ave
- 769 Bartlett Ave
- 15609 Ronda St
- 19736 Royal Ave
- 17779 Rainier Ave
- 1699 Bandoni Ave
- 16154 Via Paro
- 663 Via Mirabel
- 16146 Via Paro
- 653 Via Mirabel
- 670 Via Mirabel
- 680 Via Mirabel
- 16161 Via Paro
- 660 Via Mirabel
- 16169 Via Paro
- 16153 Via Paro
- 690 Via Mirabel
- 16138 Via Paro
- 643 Via Mirabel
- 16093 Via Del Sol
- 16145 Via Paro
- 650 Via Mirabel
- 16177 Via Paro
- 16164 Paseo Largavista
- 16137 Via Paro
- 16130 Via Paro